
Compare Fractions: Visualizing Two Fractions with Circle Areas
Loading the math board and drawing, please wait…
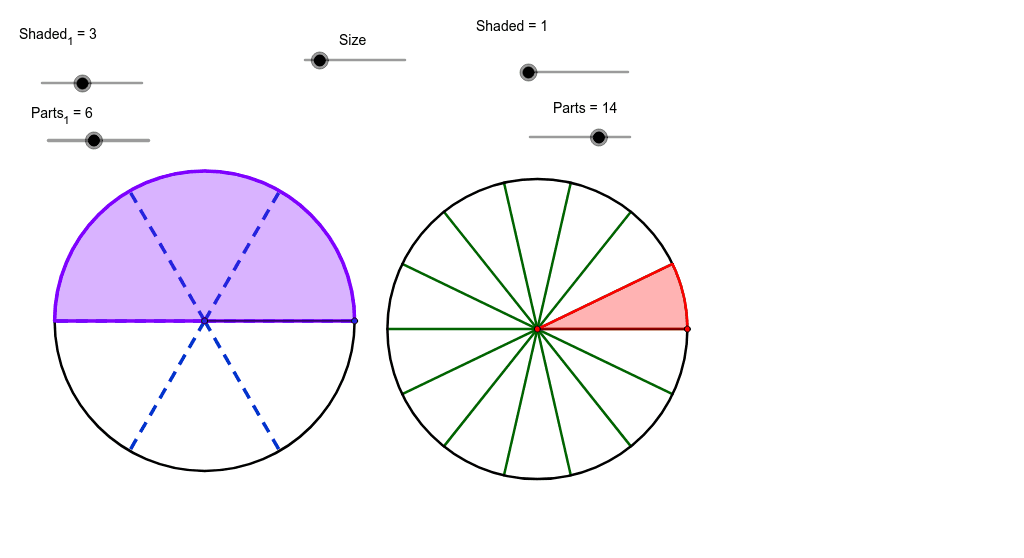
① This example uses two circles (or a single circle with two sectors) to represent fractions as shaded areas, allowing a direct visual comparison of their sizes. ② The core mathematical concepts include the geometric meaning of fractions, unit circle, ratios, rational numbers, and comparing fractions by area proportion. ③ Construction highlights: using GeoGebra commands such as Circle, Point, Segment, Append, CircleSector, and Zip to build the circles, define the fraction parts, and generate shaded sectors; sliders or input fields adjust the numerators and denominators to dynamically update the shaded regions. ④ Suitable for upper elementary to middle school students learning fraction concepts, ratio, and rational number comparison, as well as for teachers demonstrating fraction size visually in class or for students exploring the relationship between fractions and the unit circle.
GeoGebra Commands & Parameters
Circle(A, Size) → cPoint(c) → BSegment(A, B) → aAppend(Sequence[Rotate[B, i, A], i, (360 / Parts_1)°, 359.9*°, (360 / Parts_1)°], Rotate[B, 359.99*°, A]) → ListPCircleSector(A, B, Element[ListP, Shaded_1]) → ShadeCircle(C, Size) → dPoint(d) → DAppend(Sequence[Rotate[D, s, C], s, (360 / Parts)°, 359.9*°, (360 / Parts)°], Rotate[D, 359.99*°, C]) → ListP2CircleSector(C, D, Element[ListP2, Shaded]) → Shade2Segment(C, D) → bZip(Segment[C, W], W, ListP2) → ListS2Zip(Segment[A, Z], Z, ListP) → ListS