
Compare Exponential and Power Function
Loading the math board and drawing, please wait…
In collections
Geom. & Alg.: Exponential Functions & Logarithms
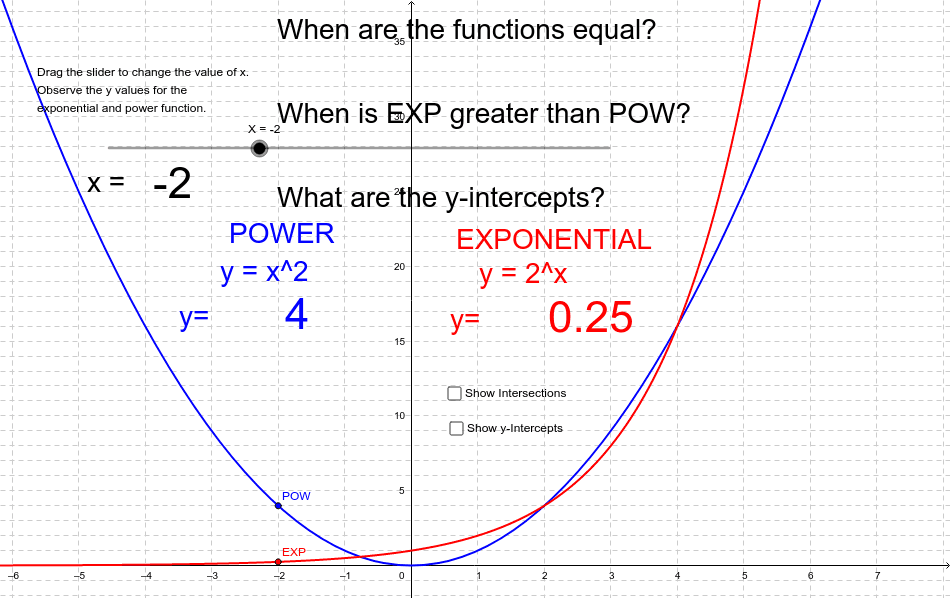
This example dynamically compares the graphs of exponential and power functions, highlighting differences in growth patterns and parameter influences. Key math concepts include function graphing, exponential growth, power function behavior, and parameter effects. GeoGebra commands like Text and Intersect, along with objects such as f, c, text1-12, POW, EXP, and variables A-E, are used to annotate and calculate intersections. Suitable for high school and advanced learners exploring function types and parameter impacts.
GeoGebra Commands & Parameters
Text(y(POW)) → text3Text(y(EXP)) → text4Text(X) → text7Intersect(f, c) → A, B, CIntersect(f, yAxis, (0, 1)) → DIntersect(yAxis, xAxis) → E
AI Drawing Prompt Reference
Draw the graphs of an exponential function and a power function, labeling their equations and the X and Y axes. Calculate and mark the intersection points among the three function graphs, as well as a specific intersection with the Y-axis. Finally, annotate the coordinates of key points next to the graph to compare the growth patterns and parameter effects of the two function types.
The prompt above was compiled from the original drawing commands and is for reference only.