
Common Denominators with Rectangles
Loading the math board and drawing, please wait…
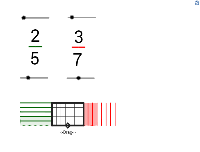
① This manipulative demonstrates how rectangles can be used to visualize common denominators, showing how fractions with different denominators can be represented as equal-area parts of a whole. ② The core mathematical concepts include common denominators, equivalent fractions, and the area model for fractions, emphasizing the connection between geometry and arithmetic. ③ Construction details: using GeoGebra commands such as Segment, Point, Sequence, and Polygon, the applet creates a rectangular grid with multiple points, segments, polygons (poly1), and text labels (text1-text6), managed through lists (list1-list6) to dynamically adjust the number of divisions. ④ It is suitable for upper elementary to middle school students learning fraction operations, and can be used for classroom demonstrations or independent exploration to build a solid conceptual foundation for comparing and adding fractions.
GeoGebra Commands & Parameters
Segment((0, 0), ((-d_2), 0)) → ePoint(e) → DSequence(Segment[(i + s, 0), (i + s, d_1)], i, 1, d_2, 1) → list1Sequence(Polygon[(0 + i - 1 + s, 0), (0 + i + s, 0), (0 + i + s, d_1), (0 + i - 1 + s, d_1)], i, 1, n_2, 1) → list3Sequence(Polygon[((-d_2) + s, 0 + i - 1), ((-d_2) + s, 0 + i), (((-2) * d_2) + s, 0 + i), (((-2) * d_2) + s, 0 + i - 1)], i, 1, n_1, 1) → list4Sequence(Segment[(i - d_2, 0), (i - d_2, d_1)], i, 1, d_2, 1) → list5Sequence(Segment[((-d_2), i), (0, i)], i, 0, d_1, 1) → list6Polygon((0, 0), (0, d_1), ((-d_2), d_1), ((-d_2), 0)) → poly1, a, b, c, dSequence(Segment[(0 - d_2 + s, i), (((-2) * d_2) + s, i)], i, 1, d_1, 1) → list2
AI Drawing Prompt Reference
Draw a diagram with two adjacent rectangles sharing a common side. The left rectangle is divided into horizontal strips of equal height, while the right rectangle is divided into vertical columns of equal width. The entire figure forms a larger rectangle with internal grid lines. Use different colors or shading to highlight certain sub-rectangles to illustrate the area model for common denominators. Include sliders to adjust the number of divisions and display fraction labels. Start by drawing the outer boundary, then add the horizontal and vertical dividing lines, and finally fill some small rectangles and add text annotations.
The prompt above was compiled from the original drawing commands and is for reference only.