
Coin Flip Preference Simulation
Loading the math board and drawing, please wait…
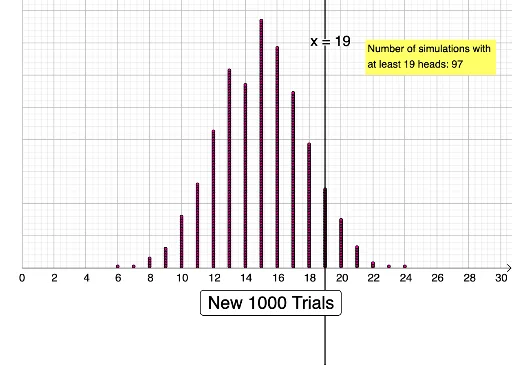
This example demonstrates a coin flip preference simulation. It involves core concepts of binomial distribution and probability & statistics. Using GeoGebra commands Sequence, DotPlot, and CountIf, the simulation results of coin flips are constructed. Suitable for high school or university probability & statistics courses.
GeoGebra Commands & Parameters
Sequence(RandomBinomial[30, 0.5], w, 1, 1000) → l1DotPlot(l1) → l2CountIf(x ≥ 19, l1) → a
AI Drawing Prompt Reference
Create a visualization for a coin flip preference simulation, showing a sequence of 1000 coin flip results, its distribution as a dot plot, and a count of occurrences where the flips are 19 or more. Generate the sequence first, then plot it as a dot plot, and finally display the count of specific occurrences.
The prompt above was compiled from the original drawing commands and is for reference only.