
Cobweb Slope
Loading the math board and drawing, please wait…
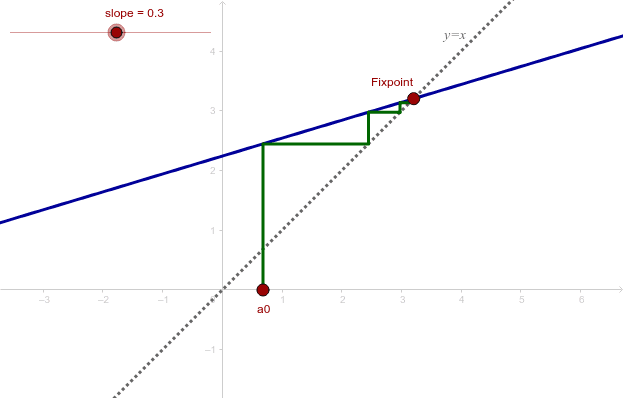
This example demonstrates the effect of slope on the attracting property of a fixed point. Key mathematical concepts include functions, fixed points, and slopes. Using commands like Point, OrthogonalLine, and Segment from the construction summary, a cobweb diagram can be drawn. Suitable for high school mathematics education and learning.
GeoGebra Commands & Parameters
Point(xAxis) → A0OrthogonalLine(A0, xAxis) → aPoint(c) → FixpointSegment((A1, A2), (A2, A2)) → C1Segment((A2, A2), (A2, A3)) → B2Segment((A2, A3), (A3, A3)) → C2Segment((A3, A3), (A3, A4)) → B3Segment((A3, A4), (A4, A4)) → C3Segment((A4, A4), (A4, A5)) → B4Segment((A4, A5), (A5, A5)) → C4Segment((A5, A5), (A5, A6)) → B5Segment((A5, A6), (A6, A6)) → C5Segment((A6, A6), (A6, A7)) → B6Segment((A6, A7), (A7, A7)) → C6Segment((A7, A7), (A7, A8)) → B7Segment((A7, A8), (A8, A8)) → C7Segment((A8, A8), (A8, A9)) → B8Segment((A8, A9), (A9, A9)) → C8Segment((A9, A9), (A9, A10)) → B9Segment((A9, A10), (A10, A10)) → C9Segment((A10, A10), (A10, A11)) → B10Segment((A10, A11), (A11, A11)) → C10Segment((A11, A11), (A11, A12)) → B11Segment((A11, A12), (A12, A12)) → C11Segment((A12, A12), (A12, A13)) → B12Segment((A12, A13), (A13, A13)) → C12Segment((A13, A13), (A13, A14)) → B13Segment((A13, A14), (A14, A14)) → C13Segment((A14, A14), (A14, A15)) → B14Segment((A14, A15), (A15, A15)) → C14Segment((A15, A15), (A15, A16)) → B15Segment((A15, A16), (A16, A16)) → C15Segment((A16, A16), (A16, A17)) → B16Segment((A16, A17), (A17, A17)) → C16Segment((A17, A17), (A17, A18)) → B17Segment((A17, A18), (A18, A18)) → C17Segment((A18, A18), (A18, A19)) → B18Segment((A18, A19), (A19, A19)) → C18Segment((A19, A19), (A19, A20)) → B19Segment((A19, A20), (A20, A20)) → C19Segment((A20, A20), (A20, A21)) → B20Segment((A20, A21), (A21, A21)) → C20Segment((A21, A21), (A21, A22)) → B21Segment((A21, A22), (A22, A22)) → C21Segment((A1, 0), (A1, A2)) → b
AI Drawing Prompt Reference
Draw a cobweb diagram for a function's attracting point. Start by taking a point A0 on the x-axis and drawing a perpendicular line a through A0. Then, take a fixed point Fixpoint on line a and draw a series of vertical segments, each starting from the end of the previous segment and ending on the x-axis, forming a spiderweb-like structure to illustrate the effect of the function's slope on the attracting point.
The prompt above was compiled from the original drawing commands and is for reference only.