
Clock Fractions: Visualizing Fractions with Circles and Sectors
Loading the math board and drawing, please wait…
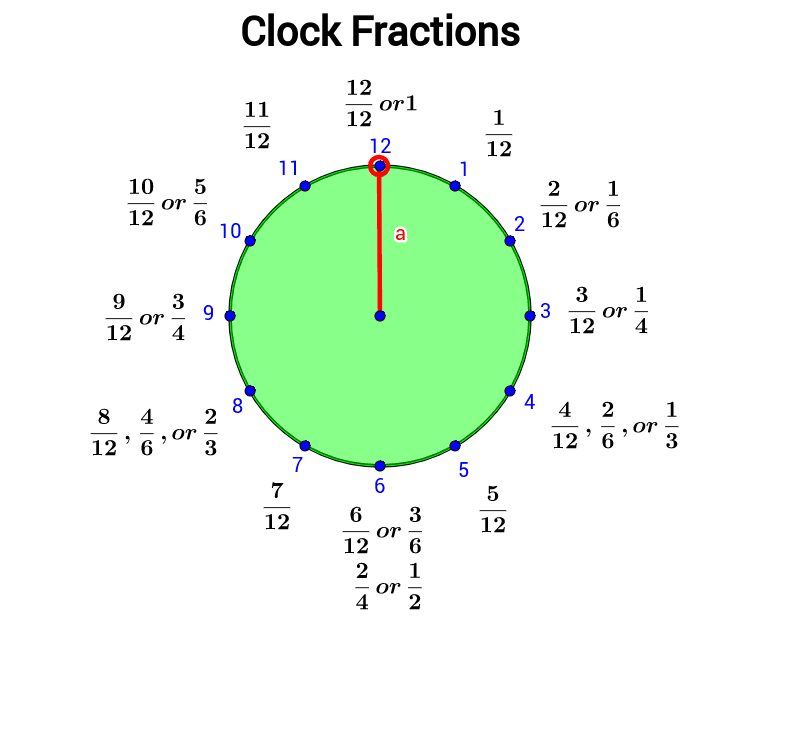
This GeoGebra example uses a clock-face circle to intuitively connect fractions with geometric shapes such as circles, sectors, and angles. It demonstrates how dividing a circle into 12 equal parts (representing hours) maps each part to the fraction 1/12, and how each sector corresponds to a central angle of 30 degrees, reinforcing the proportional relationship between fractions and angles. Core mathematical concepts include fraction fundamentals, equal partitioning of a unit circle, central angles, and the link between fractional parts and geometric distribution. The construction employs GeoGebra commands: Circle to create circle c, Point to place 12 points (A through M) on the circumference, Segment to draw clock hands, CircleSector to generate sector regions, Angle to measure angle α, and multiple text objects (text01 to text13) to label fractions and angle values. This resource is suitable for upper elementary to middle school students, aiding in fraction comprehension, angle measurement, and interdisciplinary learning between arithmetic and geometry. It also serves as a template for teachers creating interactive manipulatives.
GeoGebra Commands & Parameters
Circle((0, 0), 3) → cPoint(Circle[O, 3]) → MSegment(O, M) → aCircleSector(O, M, A) → dAngle(M, O, A) → α
AI Drawing Prompt Reference
Draw a clock face by dividing a circle into 12 equal parts, each representing an hour, and use sectors to show the fraction 1/12 for each hour. Display the central angle for each sector, label the fraction and angle values for each hour, and draw straight lines from the center to the circumference to form clock hands.
The prompt above was compiled from the original drawing commands and is for reference only.