
Classifying Stationary Points with the 2nd Derivative
Loading the math board and drawing, please wait…
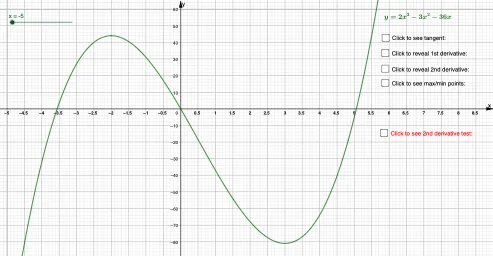
This example demonstrates how to classify stationary points of a function (local maxima or minima) using the second derivative test. Key math concepts include derivatives, function graphs, stationary points, and the second derivative test. Construction highlights involve GeoGebra commands/objects like Tangent, Max, and Min as summarized; suitable for high school mathematics teaching or self-study to understand the application of derivatives in function analysis.
GeoGebra Commands & Parameters
Tangent(P, f) → gMax(f, -5, 6) → AMin(f, -6, 6) → B
AI Drawing Prompt Reference
Draw the graph of a function and mark two stationary points on it, one local maximum and one local minimum. Draw tangent lines at the local maximum and minimum to demonstrate how to classify stationary points using the second derivative test.
The prompt above was compiled from the original drawing commands and is for reference only.