
Circle Area and Probability Demo
Loading the math board and drawing, please wait…
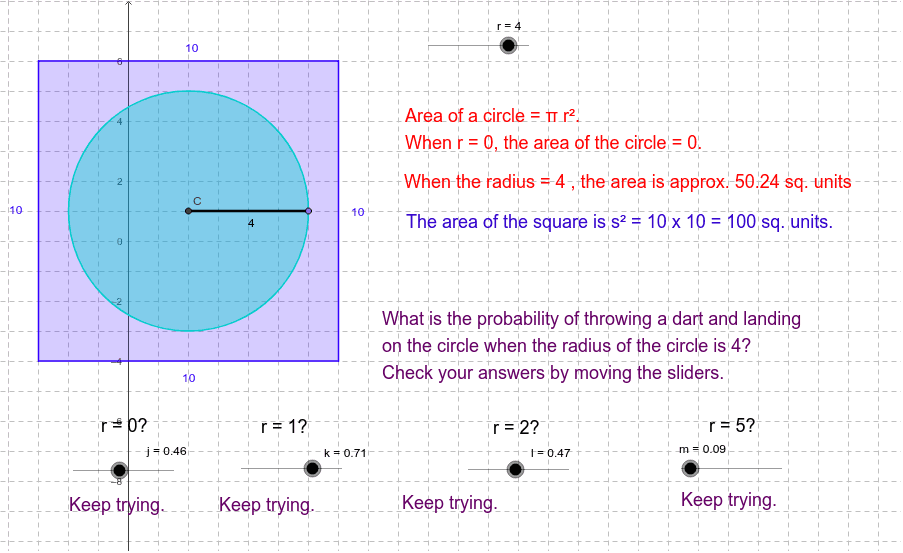
This example dynamically demonstrates the relationship between circle area and probability, highlighting the application of geometric shapes in probability calculations. Core math concepts include circle area formulas, probability computation, fractions, symmetry, and polygon construction. GeoGebra commands used for construction are: Polygon, Segment, Intersect, Circle, Point, and If. Suitable for high school mathematics education, helping students understand the intersection of geometry and probability and the practical use of dynamic geometry software.
GeoGebra Commands & Parameters
Polygon(A, B, G, D) → P, a, b, c, dSegment(A, G) → eSegment(B, D) → fIntersect(e, f) → CCircle(C, 0) → hCircle(C, r) → gPoint(g) → ESegment(C, E) → iIf(j ≟ 0, T9, T10) → T11If(j ≟ 0.31, T11, T10) → T16If(l ≟ 0.12, T14, T10) → T17If(k ≟ 0.03, T13, T10) → T12If(m ≟ 0.78, T15, T10) → T18
AI Drawing Prompt Reference
Draw a circle g with center C, then randomly select a point E inside the circle and draw a line segment i from C to E. Construct a quadrilateral ABGD, and draw line segments e and f that intersect at point C. Finally, use circle h to represent a part of circle g, illustrating the relationship between circle area and probability.
The prompt above was compiled from the original drawing commands and is for reference only.