
Centroid & Pie Chart with Linear Equations
Loading the math board and drawing, please wait…
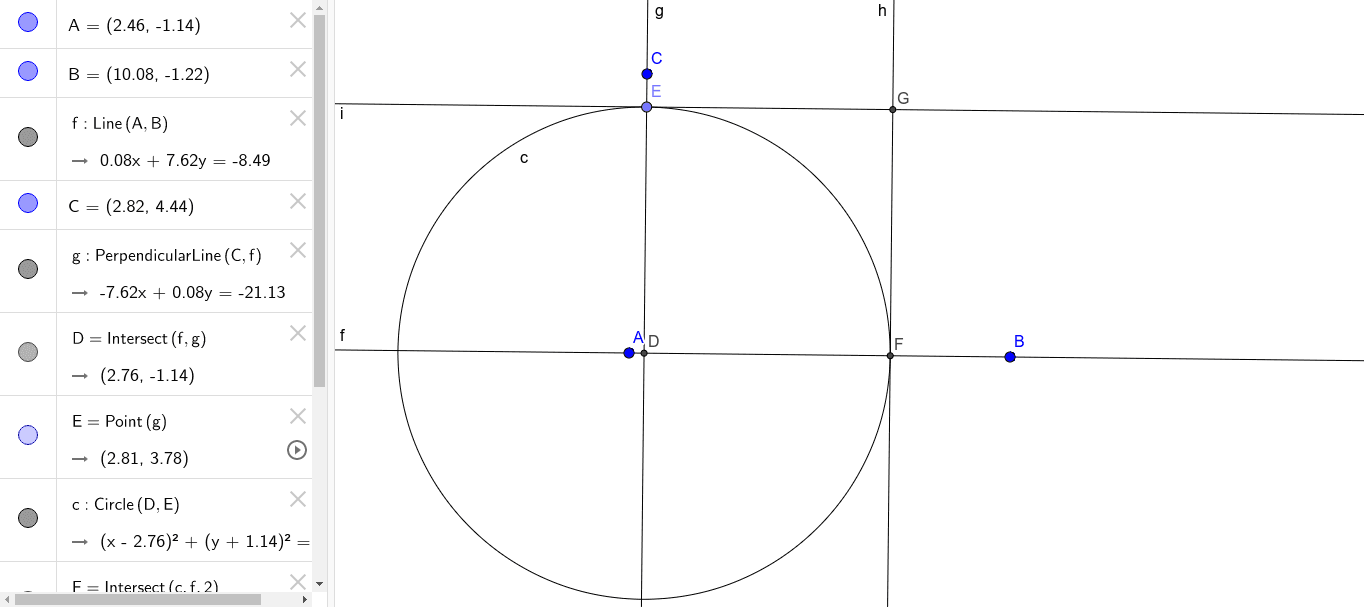
This example demonstrates constructing a triangle's centroid using GeoGebra and integrating it with a pie chart to visualize linear equations and rational numbers. Core math concepts include centroid, pie chart, linear equations, rational numbers, and symmetry. Construction involves commands like Line, OrthogonalLine, Intersect, Point, and Circle. Suitable for high school mathematics teaching, combining geometric construction with data analysis.
GeoGebra Commands & Parameters
Line(A, B) → fOrthogonalLine(C, f) → gIntersect(f, g) → DPoint(g) → ECircle(D, E) → cIntersect(c, f, 2) → FOrthogonalLine(F, f) → hOrthogonalLine(E, g) → iIntersect(h, i) → G
AI Drawing Prompt Reference
Draw a triangle and find its centroid. Then, construct an orthogonal line through one side of the triangle, find the intersection as the center of a circle, and draw the circle. Next, construct another intersection point using the circle and one side of the triangle, and then construct two more orthogonal lines through this point, finding their intersection as another key point of the triangle.
The prompt above was compiled from the original drawing commands and is for reference only.