
Central Limit Theorem for Samples from a Binomial Distribution
Loading the math board and drawing, please wait…
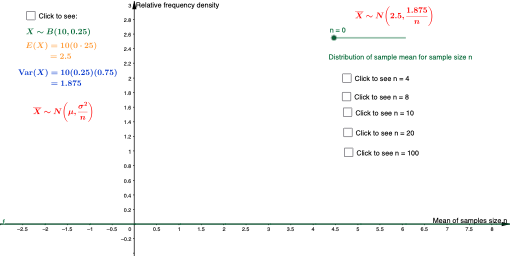
This GeoGebra example demonstrates the central limit theorem by comparing the distribution of sample means or sums drawn from a binomial distribution with a normal distribution. It highlights binomial probability, random sampling, sample size, success probability, mean, standard deviation, and convergence to normality. The construction uses Histogram to display the empirical distribution of repeated samples, Normal to overlay the theoretical normal curve, and BinomialDist to model the underlying binomial experiment. Labeled points and input objects such as A, B, D, E, G, H, J, K, M, and N likely control trial count, probability, sample size, bin width, and displayed statistics. It is suitable for high school probability extensions, introductory college probability and statistics, and classroom simulations of sampling distributions.
GeoGebra Commands & Parameters
Histogram(list1, list8) → n_8Histogram(list1, list10) → n_10Histogram(list1, list20) → n_20Histogram(list1, list100) → n_100Normal(2.5, sqrt(1.875 / n), x, false) → fBinomialDist(10, 0.25) → gHistogram(list1, list4) → i
AI Drawing Prompt Reference
Draw a graph showing the distribution of sample means from a binomial distribution. First, create a binomial distribution model with parameters for trial count and success probability. Then, generate histograms of sample means to show their distribution shape. Next, overlay a normal curve to simulate the theoretical distribution of sample means. Finally, add statistical information like mean and standard deviation to illustrate convergence to normality.
The prompt above was compiled from the original drawing commands and is for reference only.