
Center of Mass / Weighted Average
Loading the math board and drawing, please wait…
In collections
Besondere Punkte/Special Points
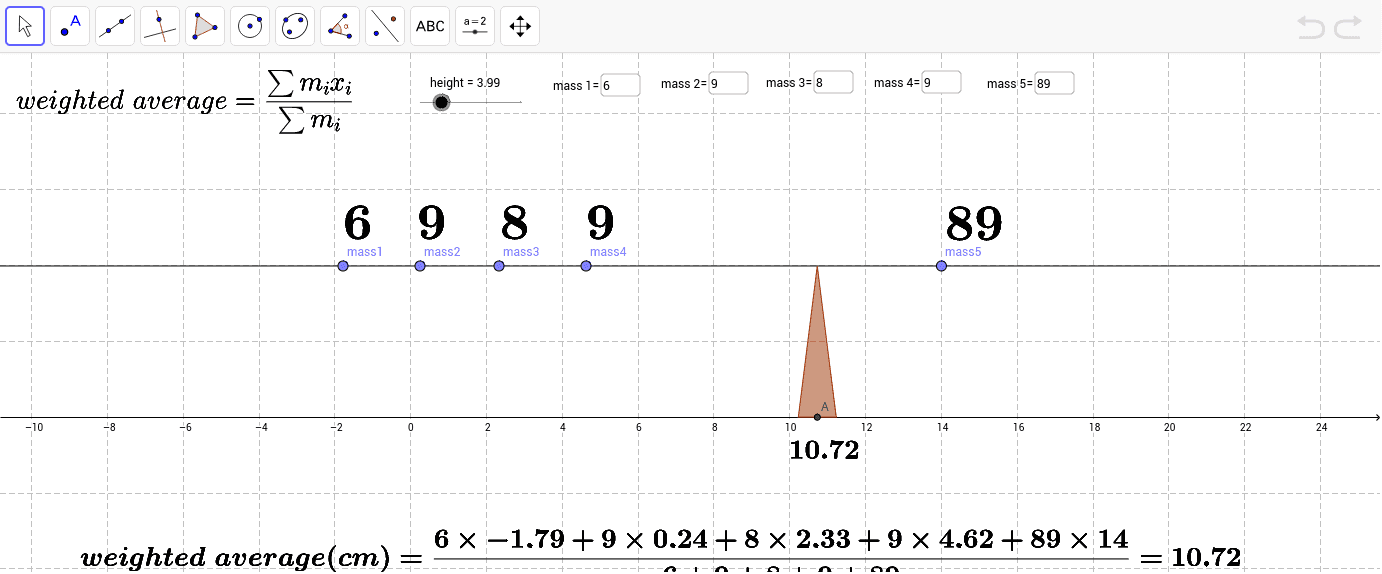
This example demonstrates how to visualize the center of mass and weighted average using GeoGebra. It involves core mathematical concepts like center of mass calculation, weighted average, and polygon construction. Key GeoGebra commands and objects used include Line, Point, Polygon, Textfield, and variables like height, a, mass1 to mass5, xcm, A to D, poly1, d, c, b. Suitable for high school and above students learning about physics or mathematics concepts of center of mass and weighted average.
GeoGebra Commands & Parameters
Line((0, height), (1, height)) → aPoint(a) → mass1Point(a) → mass2Point(a) → mass3Point(a) → mass4Point(a) → mass5Polygon(C, B, D) → poly1, d, c, bTextfield(masss1) → inputBox1Textfield(masss2) → inputBox2Textfield(masss3) → inputBox3Textfield(masss4) → inputBox4Textfield(masss5) → inputBox5
AI Drawing Prompt Reference
Draw a shape consisting of five horizontal line segments and five points, with each point located on a line segment representing different masses. Connect these points to form a polygon and label the mass value at each point. Finally, calculate and display the centroid of the polygon to visualize the concept of center of mass.
The prompt above was compiled from the original drawing commands and is for reference only.