
Cartesian to Polar Grapher
Loading the math board and drawing, please wait…
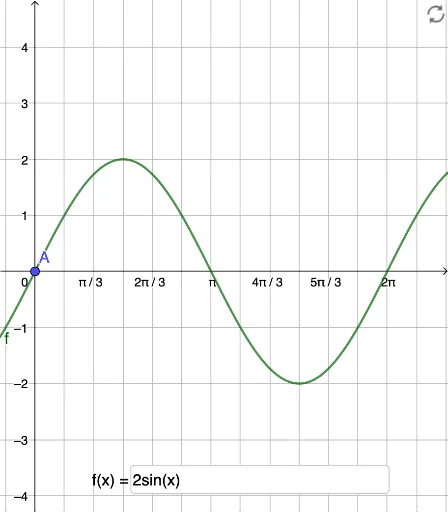
This example demonstrates how to convert Cartesian coordinate functions into polar coordinate graphs using GeoGebra. It involves core mathematical concepts such as coordinate geometry, polar coordinate systems, and function graph transformations. Key construction elements include Textfield, objects A, B, data, buttons (button1, button2, button3), function f, variable b, and InputBox1. Suitable for high school mathematics education to help students understand coordinate system transformations and the diversity of function graphs.
GeoGebra Commands & Parameters
Textfield(f) → InputBox1
AI Drawing Prompt Reference
Create a graph that converts Cartesian coordinate functions into polar coordinate graphs, featuring a text field to display the function, an input box for entering the function, and three buttons to control the display, showing the transformation of function graphs in polar coordinates, suitable for educational purposes.
The prompt above was compiled from the original drawing commands and is for reference only.