
Car Depreciation Example
Loading the math board and drawing, please wait…
In collections
CCGPS AA Unit 4 Lesson 1
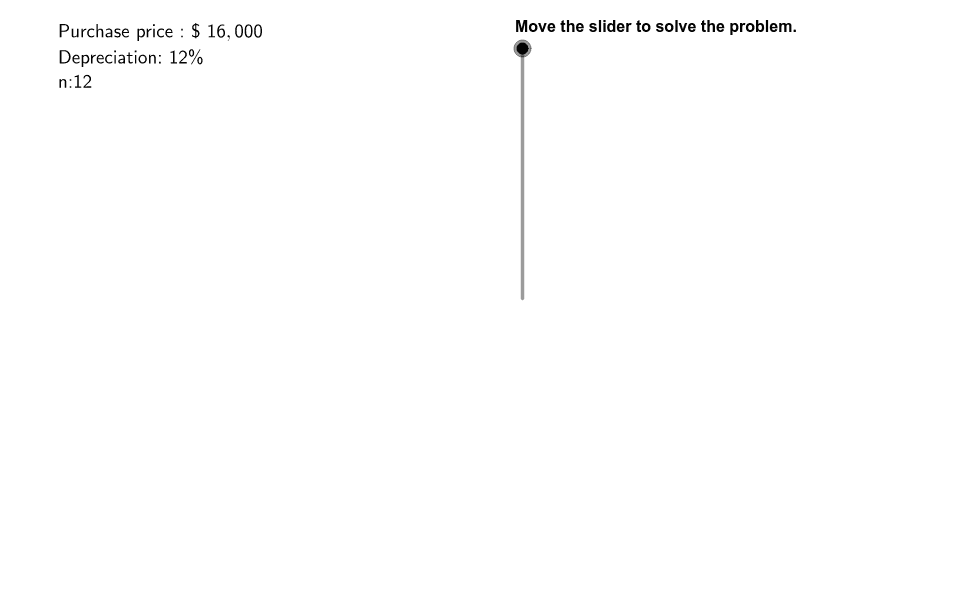
This example demonstrates the exponential decay of a car's value over time. It involves core math concepts like exponential functions and compound interest calculations. Constructed using commands such as Corner, Intersect, TableText, and objects like MaskEdge, Directions2, DirectionsSlider for a dynamic model. Suitable for high school students learning applications of exponential functions and data visualization.
GeoGebra Commands & Parameters
Corner(3) → C3Corner(2) → C2Intersect(xAxis, yAxis) → OriginTableText({{Formula1a, Reason1a}, {Formula1b, Reason1b}, {Formula1c, Reason1c}}) → Calculation1
AI Drawing Prompt Reference
Create a graph demonstrating car depreciation through exponential decay, featuring coordinate axes and the origin, with a table showing three formulas and their reasons for calculation, based on three constructed points forming the initial framework, presenting a dynamic model suitable for high school students studying exponential function applications and data visualization.
The prompt above was compiled from the original drawing commands and is for reference only.