
Cameroon COVID-19 Cases Bar Chart
Loading the math board and drawing, please wait…
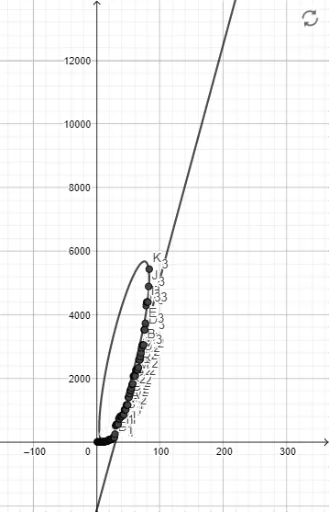
This example demonstrates a bar chart visualizing Coronavirus cases in Cameroon up to May 2020. Core math concepts include statistics, arithmetic mean, and bar graph construction. GeoGebra commands like A1, B1, ..., A20, B20 are used to plot data points. Suitable for high school mathematics education, illustrating data visualization and statistical applications.
GeoGebra Commands & Parameters
122232425262728293103115125131014151522162717271840197020702175227523752491251132613927139281392924630509