
Calculus & Statistics Visualization
Loading the math board and drawing, please wait…
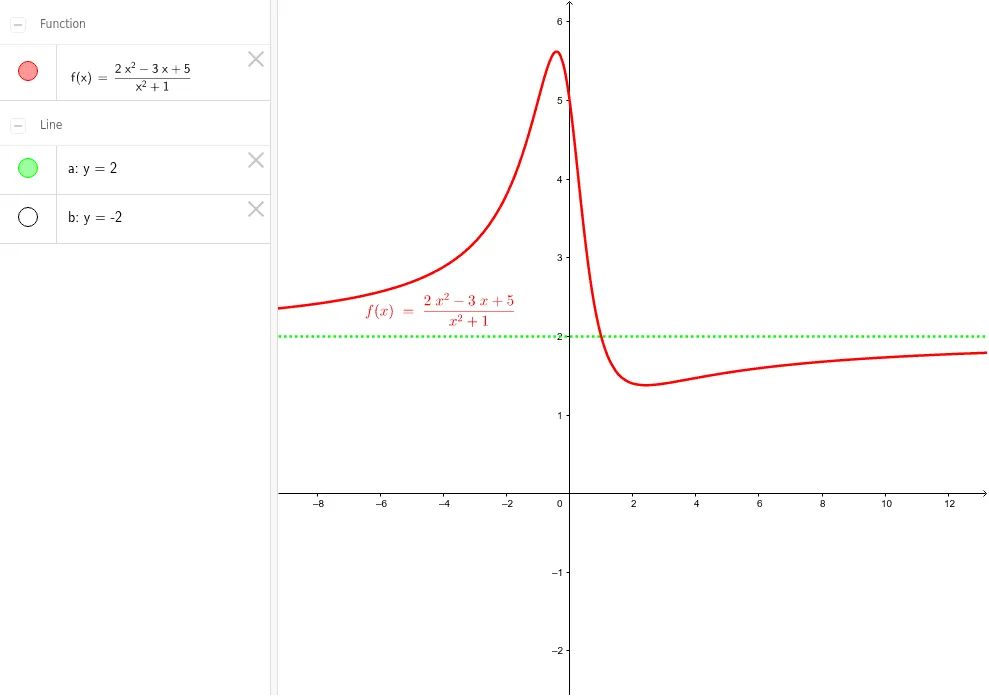
This example demonstrates how to construct function graphs, limits, boxplots, and histograms using GeoGebra, integrating calculus and statistics visually. Core math concepts include limits, real numbers, solids, histograms, and cylinders. Construction uses GeoGebra objects f (function), a (parameter), b (parameter). Suitable for high school and above students learning calculus, statistics, and data visualization.
GeoGebra Commands & Parameters
f(x) = ((2 * x^(2)) - (3 * x) + 5) / (x^(2) + 1)Line a(0.0, 1.0, -2.0)Line b(0.0, 1.0, 2.0)
AI Drawing Prompt Reference
Draw a function graph with the expression (2x^2 - 3x + 5) / (x^2 + 1), and two lines with slopes -2 and 2, both passing through the point (0, 1).
The prompt above was compiled from the original drawing commands and is for reference only.