
Law of Large Numbers Demo by Val
Loading the math board and drawing, please wait…
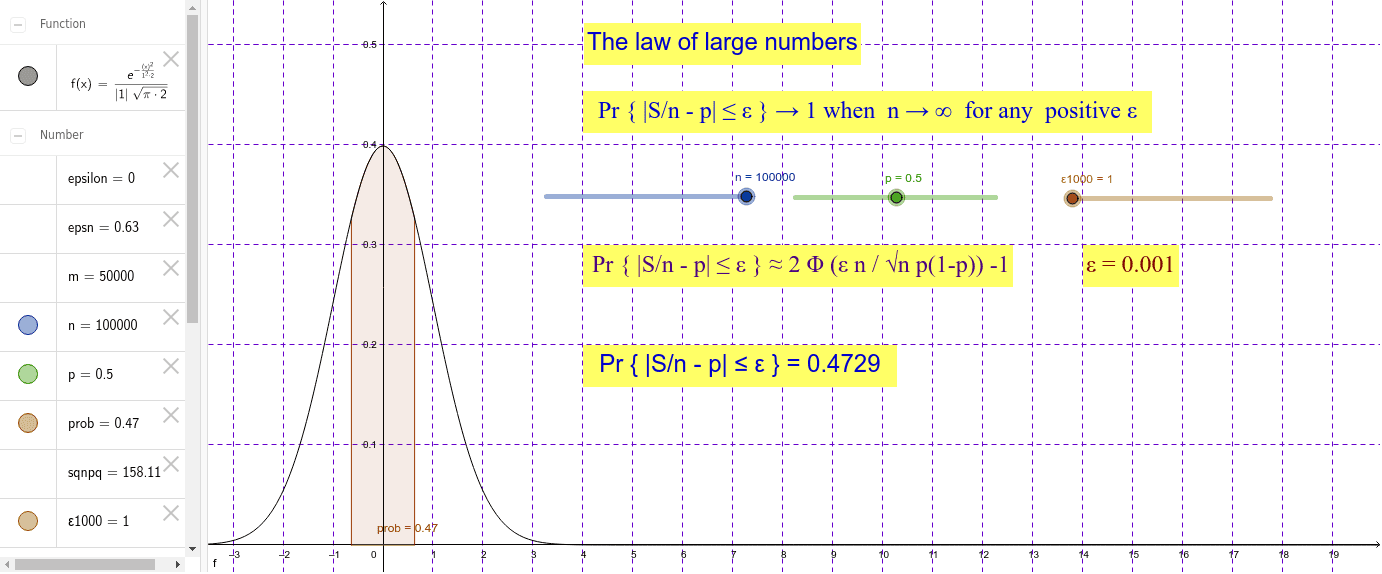
This example visually demonstrates the Law of Large Numbers, covering core concepts in Probability & Statistics, Limits, and Calculus. It constructs the normal distribution, integrates to find probabilities, and uses sliders (n, p) to show convergence. Key GeoGebra commands include Normal, Integral, ε1000, n, p, sqnpq, epsilon, f, epsn, m, prob, and text annotations. Ideal for high school and college-level teaching in probability and calculus.
GeoGebra Commands & Parameters
Normal(0, 1, x) → fIntegral(f, (-epsn), epsn) → prob
AI Drawing Prompt Reference
Draw a standard normal distribution curve with x-axis ranging from -10 to 10, then calculate and display the area under the curve in this interval to represent probability. Use sliders to adjust the values of n and p, and observe how the area under the curve approaches a certain value as n increases, illustrating the Law of Large Numbers.
The prompt above was compiled from the original drawing commands and is for reference only.