
HKCEE Calculus Practice Demo
Loading the math board and drawing, please wait…
In collections
F.5 CH. 3 Translation of Function
This example demonstrates using GeoGebra to plot function graphs, calculate upper and lower sums, and Riemann sums; Core math concepts include set theory, limits, division, kite, upper and lower sums or Riemann sums; Construction highlights from the summary involve objects a, b, text1, text2, text3, text4, f, text5, g, h, i, j, k; Suitable for high school students learning calculus.
GeoGebra Commands & Parameters
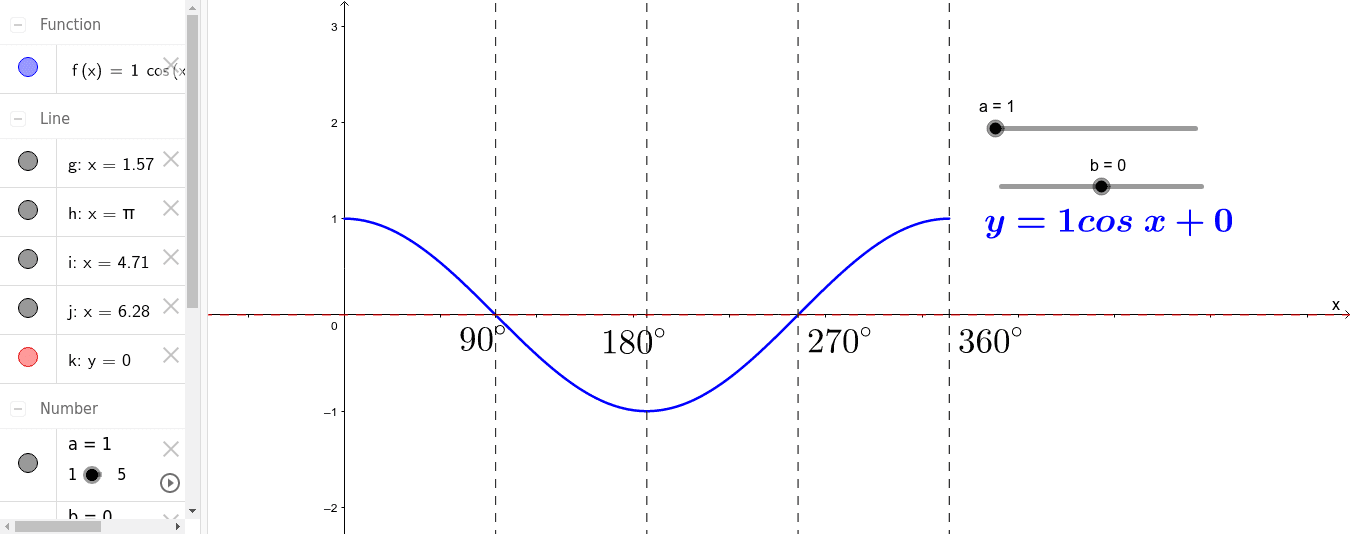
Numeric a(1.0)Numeric b(0.0)f(x) = If[0 ≤ x ≤ 6.283185307179586, (a * cos(x)) + b]x = 90°x = 180°x = 270°x = 360°y = b
AI Drawing Prompt Reference
Plot a function graph that consists of a cosine function and a horizontal line segment between 0 and 6.283185307179586, with the horizontal line at height y=b, labeled as such. Mark the points 90°, 180°, 270°, and 360° on the x-axis, and illustrate the concepts of upper and lower sums and Riemann sums for the function, suitable for high school calculus students.
The prompt above was compiled from the original drawing commands and is for reference only.