
Calculus - Connecting Rate of Change with Quantity
Loading the math board and drawing, please wait…
In collections
AP Calculus AB Applet Collection
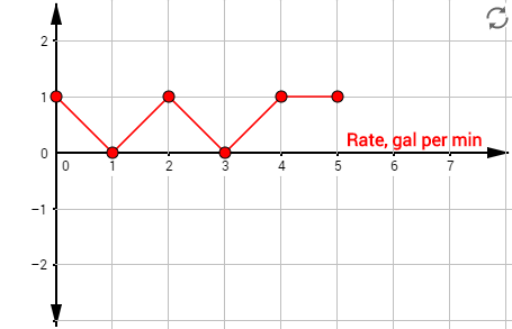
This example demonstrates the fundamental concept of calculus: connecting a changing quantity with its rate of change. By adjusting the rate of water level change, you can observe the change in water level height. The construction uses GeoGebra commands such as point and slope, suitable for high school and above students learning calculus.
GeoGebra Commands & Parameters
Point(rline1) → RP1Point(rline0) → RP0Slope(r1) → m1Point(rline2) → RP2Slope(r2) → m2Point(rline3) → RP3Point(rline4) → RP4Point(rline5) → RP5Slope(r3) → m3Slope(r4) → m4Slope(r5) → m5
AI Drawing Prompt Reference
Draw a water tank with water level changing over time. Adjust the water level change rate and observe the change in water level. Use points and slopes to represent the water level and its change rate, illustrating the relationship between a quantity and its rate of change in calculus.
The prompt above was compiled from the original drawing commands and is for reference only.