
Calculate Profit or Loss Percentage
Loading the math board and drawing, please wait…
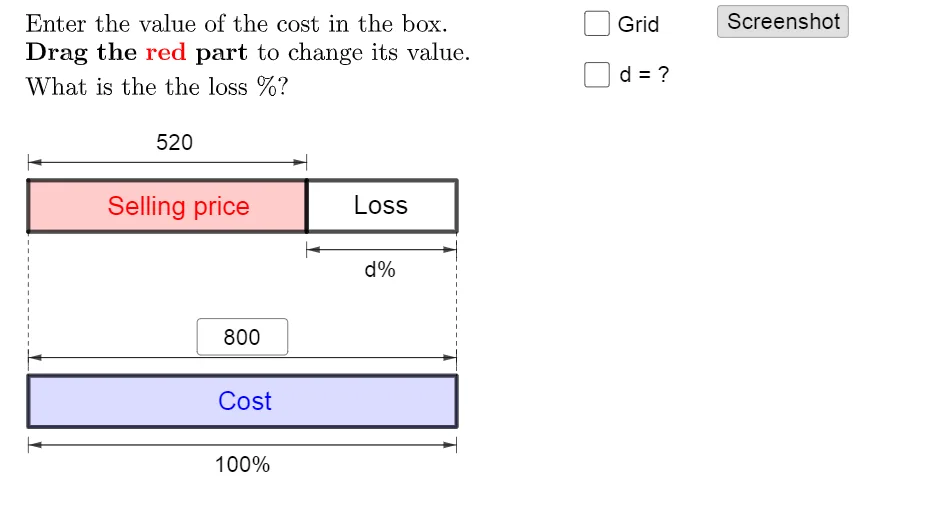
This example demonstrates how to use GeoGebra to calculate and visualize profit or loss percentage. The core math concepts involved include algebra, arithmetic, and percentage calculations. Construction highlights involve using commands like If for conditional logic, Point and Polygon objects to create shapes, Sequence to generate sequence data, Textfield and Segment to display and construct graphical elements, and Vector to represent vectors. Suitable for middle school students and above to learn and understand basic concepts in business mathematics.
GeoGebra Commands & Parameters
If(a, "d", ((If[p ∧ x(P) < 10, "-"] * abs(d)) * "")) → dtextIf(c', "c", (n * "")) → ntextPoint(yAxis) → APoint(yAxis) → BIf(x(P) ≤ 10, A + (10, 0), B + (10, 0)) → A0If(x(P) ≤ 10, P, (x(P), y(B))) → P0Polygon(P, Q, (0, y(Q)), (0, y(P))) → q1, p_1, q_1, g, hPolygon({P0, A0, A0 + (0, 1), P0 + (0, 1)}) → q2Polygon({B, B + (10, 0), B + (10, 1), B + (0, 1)}) → q3Polygon({B, B + (10, 0), B + (10, 1), B + (0, 1)}) → q4Sequence(Segment[B + (i, 0), B + (i, 1)], i, 1, 9, 1) → l1Sequence(Sequence[Segment[B + (j + i, 0), B + (j + i, 1)], j, 0, 9, 1], i, 0.1, 0.9, 0.1) → l2Sequence(Segment[A + (i, 0), A + (i, 1)], i, 1, 9, 1) → l3Sequence(Sequence[Segment[A + (j + i, 0), A + (j + i, 1)], j, 0, 9, 1], i, 0.1, 0.9, 0.1) → l4Textfield(n) → InputBox1Textfield(m) → InputBox2If(b, "s", (m * "")) → mtextSegment(If[b_1 ≟ 0, A, A0] + (0, 1.2), If[b_1 ≟ 0, A, A0] + (0, 1.5)) → iSegment(If[b_1 ≟ 0, P, P0] + (0, 1.2), If[b_1 ≟ 0, P, P0] + (0, 1.5)) → jVector(Midpoint[i], Midpoint[j]) → uVector(Midpoint[j], Midpoint[i]) → vSegment(A0 - (0, 0.2), A0 - (0, 0.5)) → kSegment(P0 - (0, 0.2), P0 - (0, 0.5)) → lVector(Midpoint[k], Midpoint[l]) → wVector(Midpoint[l], Midpoint[k]) → eSegment(B + (0, 1.2), B + (0, 1.5)) → fSegment(B + (10, 1.2), B + (10, 1.5)) → rVector(Midpoint[f], Midpoint[r]) → sVector(Midpoint[r], Midpoint[f]) → tSegment(B - (0, 0.2), B - (0, 0.5)) → f_1Segment(B + (10, -0.2), B + (10, -0.5)) → g_1Vector(Midpoint[f_1], Midpoint[g_1]) → u_1Vector(Midpoint[g_1], Midpoint[f_1]) → v_1If(a, "d", If[b, If[b_1 ≟ 0, "s", "x"], "c"]) → text12Sequence(Segment[A + (10 + i, 0), A + (10 + i, 1)], i, 0.1, x(P) - 10, 0.1) → l6Sequence(Segment[A + (10 + i, 0), A + (10 + i, 1)], i, 0, floor(x(P) - 10)) → l5Sequence(Segment[A0 + (i, 0), A0 + (i, 1)], i, 0, floor(x(P0) - 10)) → l7Sequence(Segment[A0 + (i, 0), A0 + (i, 1)], i, 0.1, x(P0) - 10, 0.1) → l8If(p, m - n, abs(n - m)) → cSegment(If[x(P) ≤ 10, A + (10, 0), P], If[x(P) ≤ 10, B + (10, 1), x(P)]) → h_1Segment(A, B + (0, 1)) → i_1Segment(A - (0, 0.2), A - (0, 0.5)) → j_1Segment(P - (0, 0.2), P - (0, 0.5)) → k_1Vector(Midpoint[k_1], Midpoint[j_1]) → w_1Vector(Midpoint[j_1], Midpoint[k_1]) → c_1Segment(A0 + (0, 1.2), A0 + (0, 1.5)) → k'Segment(P0 + (0, 1.2), P0 + (0, 1.5)) → l'Vector(Midpoint[k'], Midpoint[l']) → e_1Vector(Midpoint[l'], Midpoint[k']) → l_1If(p, "Change", If[x(P) < 10, "Loss", If[x(P) > 10, "Profit", ""]]) → change
AI Drawing Prompt Reference
Use a coordinate plane with a vertical axis as reference. Choose two points on the vertical axis to define the upper and lower boundaries, then construct segmented rectangle-like regions to the right: for positions at and beyond a threshold, let the left boundary be set by the vertical axis while the top and bottom edges follow the respective heights, forming polygons that emphasize a profit/loss style comparison. On the right side of the upper and lower regions, add narrow vertical band sections and subdivide them with evenly spaced short vertical segments within a specified height range, repeating the band shape to strengthen the contrast. Include small offset vertical and horizontal marker segments and draw arrow-like direction indications by connecting vectors between midpoints of selected markers. Place two numeric input text boxes and corresponding equation-style text on the figure for the displayed calculation.
The prompt above was compiled from the original drawing commands and is for reference only.