
Broken Stick Triangle Simulation: Can Random Breaks Form a Triangle?
Loading the math board and drawing, please wait…
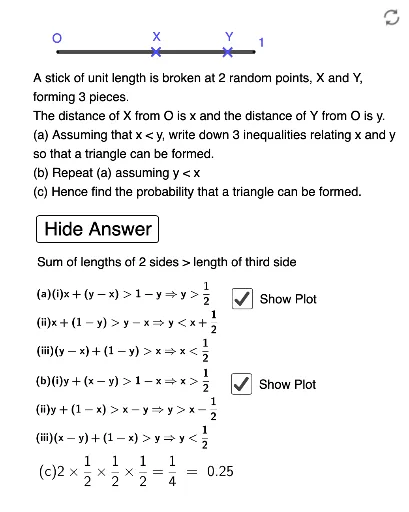
This simulation demonstrates the classic broken stick problem: a stick is randomly broken into three pieces, and the program dynamically counts how often these pieces can form a triangle, visualizing the geometric probability. Core mathematical concepts include the triangle inequality (sum of any two sides greater than the third), geometric probability, random simulation and statistical convergence, and the use of the median line in the condition. Construction highlights: using GeoGebra commands such as Min, Max, Length, RemoveUndefined, Polygon, and Segment to generate and display the three segment lengths; buttons (button2, button3, button4) control simulation count, speed, and reset; sliders (n, speed) adjust parameters; real-time updates of statistics and graphics. Suitable for high school and above for learning probability, statistics, inequalities, or mathematical experimentation, and also useful for introductory probability courses at university level.
GeoGebra Commands & Parameters
Min(x1, x2) → s1Max(l1) → smaxLength(data) → cRemoveUndefined(data) → l2Length(l2) → bPolygon((0, 0), (1, 0), 4) → poly1Polygon((0.5, 0), (1, 0.5), (0.5, 0.5)) → t1, f, g, hPolygon((0, 0.5), (0.5, 1), (0.5, 0.5)) → t2, i, j, lSegment(A, B) → f_1
AI Drawing Prompt Reference
Draw an interactive simulation of the broken stick triangle probability problem. The main view shows a square area divided into four smaller triangles by two diagonal lines, with two adjacent triangles shaded in different colors to represent the region where the triangle inequality holds. Beside or below the square, display a dynamic statistics panel showing the current number of trials, successful trials, and the estimated probability. Include a slider to adjust the number of trials, and two buttons: one to increase trials and one to reset. Also show three random segment lengths representing the three pieces of the broken stick, updating in real time. The layout should be clear for observing statistical convergence.
The prompt above was compiled from the original drawing commands and is for reference only.