
Boxplot Tool - Five Number Summary (0 to 200)
Loading the math board and drawing, please wait…
In collections
Probability & Intro. to Stat.
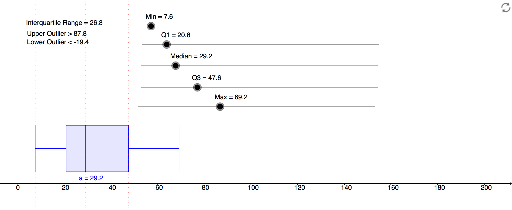
This example demonstrates how to use the GeoGebra tool to create a boxplot, showcasing the five key numerical summary values of data distribution: minimum, first quartile, median, third quartile, and maximum. The core mathematical concepts involved include data distribution, five-number summary, quartiles, boxplots, and their applications in statistics. The construction highlights the use of the BoxPlot command to generate the boxplot, along with GeoGebra commands and objects such as Min, Q1, Median, Q3, Max, a, b, c, d, e, f, Point (dependent), Curve, IQR, UpOut, DwOut, text1, and text2. It is suitable for high school mathematics statistics teaching, helping students visually understand data distribution characteristics and outlier identification.
GeoGebra Commands & Parameters
BoxPlot(15, 10, Min, Q1, Median, Q3, Max) → a
AI Drawing Prompt Reference
Create a boxplot to display the five-number summary of data, including the minimum, first quartile, median, third quartile, and maximum, with labels for these key values, and indicate the interquartile range and outliers, suitable for high school statistics teaching to help students understand data distribution characteristics and outlier identification.
The prompt above was compiled from the original drawing commands and is for reference only.