
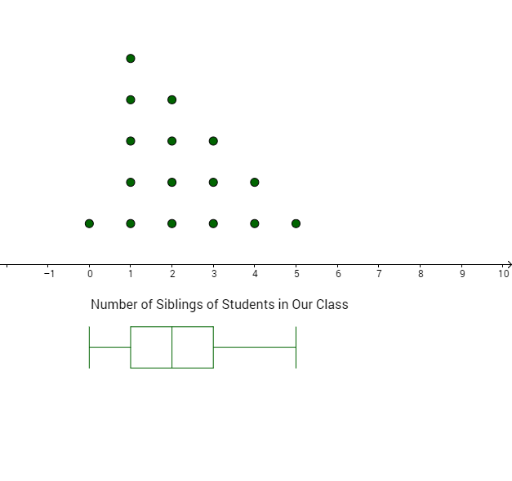
Box and Dot Plots for Number of Siblings in Class
Loading the math board and drawing, please wait…
This example demonstrates box and dot plots for the number of siblings of students in a class, involving basic statistical concepts. Using GeoGebra commands BoxPlot and DotPlot, it provides a clear visualization of data distribution. Suitable for middle school and above students to learn data statistics and analysis.
GeoGebra Commands & Parameters
BoxPlot(-2, 0.5, L) → list1DotPlot(L) → list2