
Boltzmann Transport Equation: Geometric Visualization of x²y²=-1
Loading the math board and drawing, please wait…
In collections
Complex Math
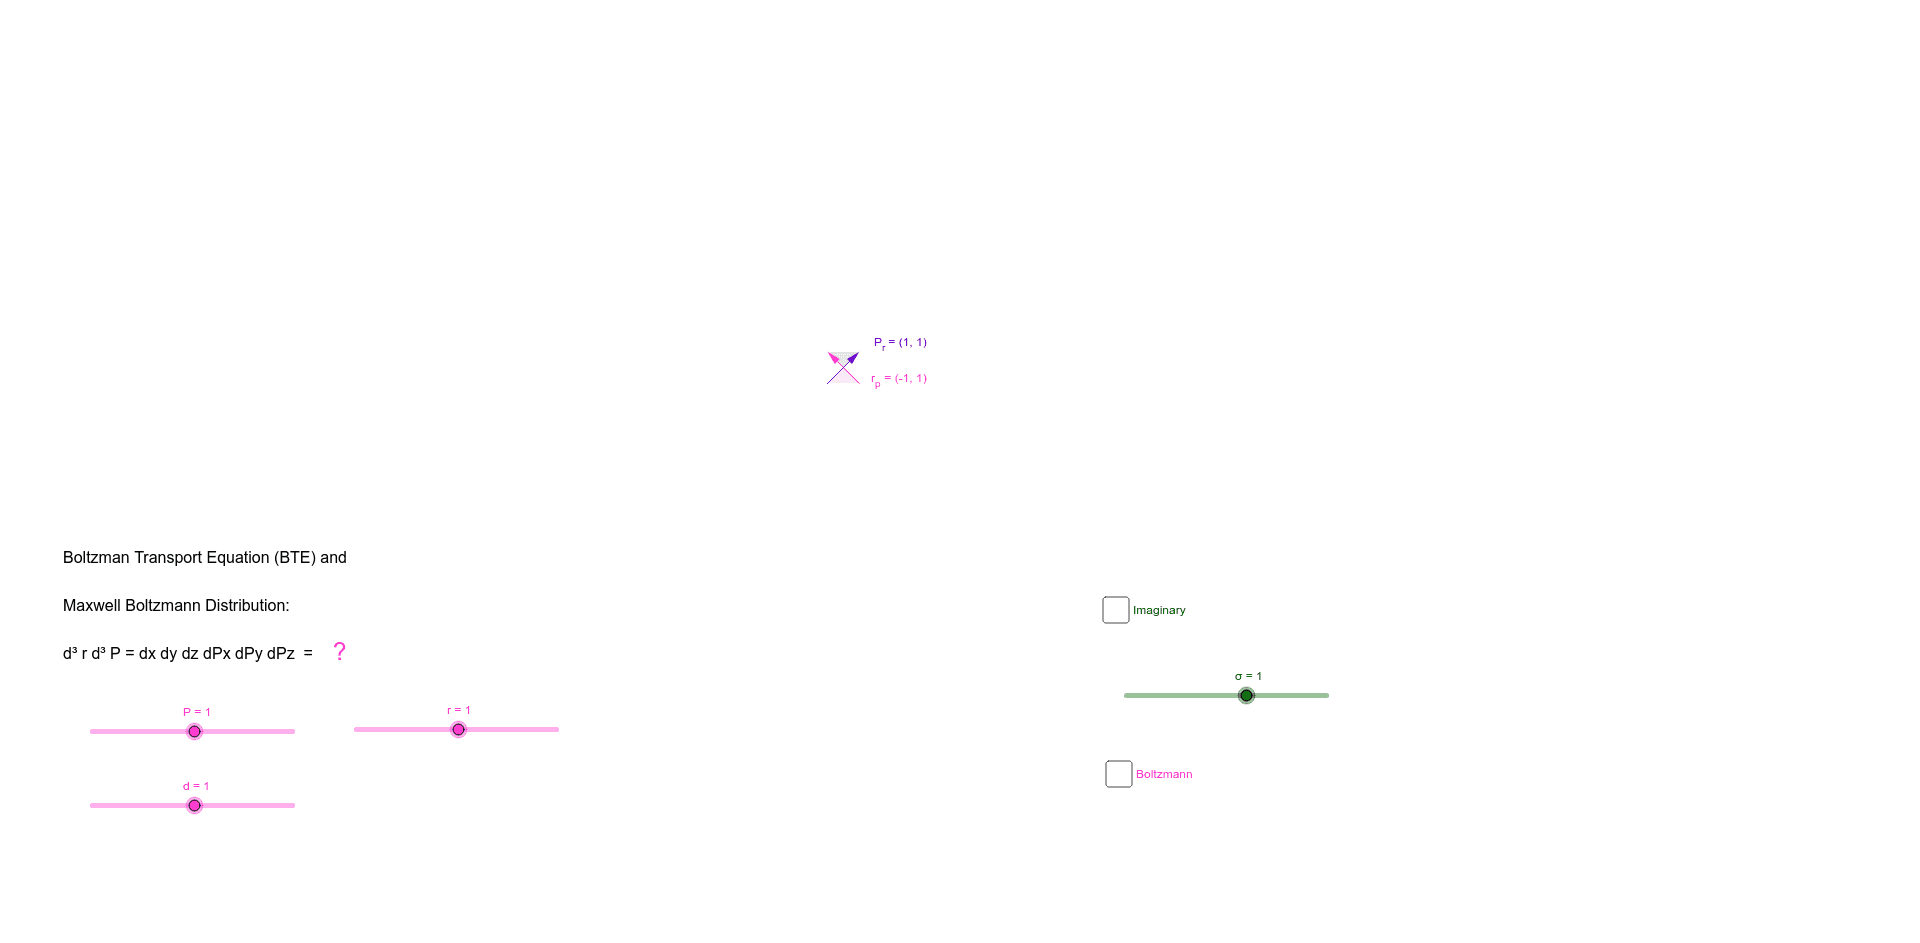
① This example visualizes the equation x²y² = -1, producing a four-fold symmetric curve that resembles imaginary-number multiplication, offering a geometric analogy to the Boltzmann transport equation. ② Core mathematical concepts include implicit functions, imaginary units, symmetry, incircles, secant lines, and orthocenters, bridging physics equations with planar geometry. ③ Construction details: Using GeoGebra commands Vector, Point, and Polygon, the construction creates objects σ, w, d, r, P, a, text1, A, B, f, b, c, r_p, P_r, text2, text1_1, text3, text4, C, D, g, text5, E, H, G, F, I, poly1, i, h, e, poly2, i_1, g_1, f_1, j, involving points, vectors, polygons, text labels, and auxiliary lines to form a complex geometric network. ④ Suitable for high school to university students studying analytic geometry, complex numbers, and symmetry, and useful as an extension for visualizing abstract equations in physics education.
GeoGebra Commands & Parameters
Vector((r, 0), (0, P)) → r_pVector((r, P)) → P_rPoint(r_p) → EPoint(P_r) → HPoint(P_r) → GPoint(r_p) → FPoint(r_p) → IPolygon(H, E, I) → poly1, i, h, ePolygon(G, F, I) → poly2, i_1, g_1, f_1