
Bisection Method for Real Roots by DR. SREEKUMAR. K G
Loading the math board and drawing, please wait…
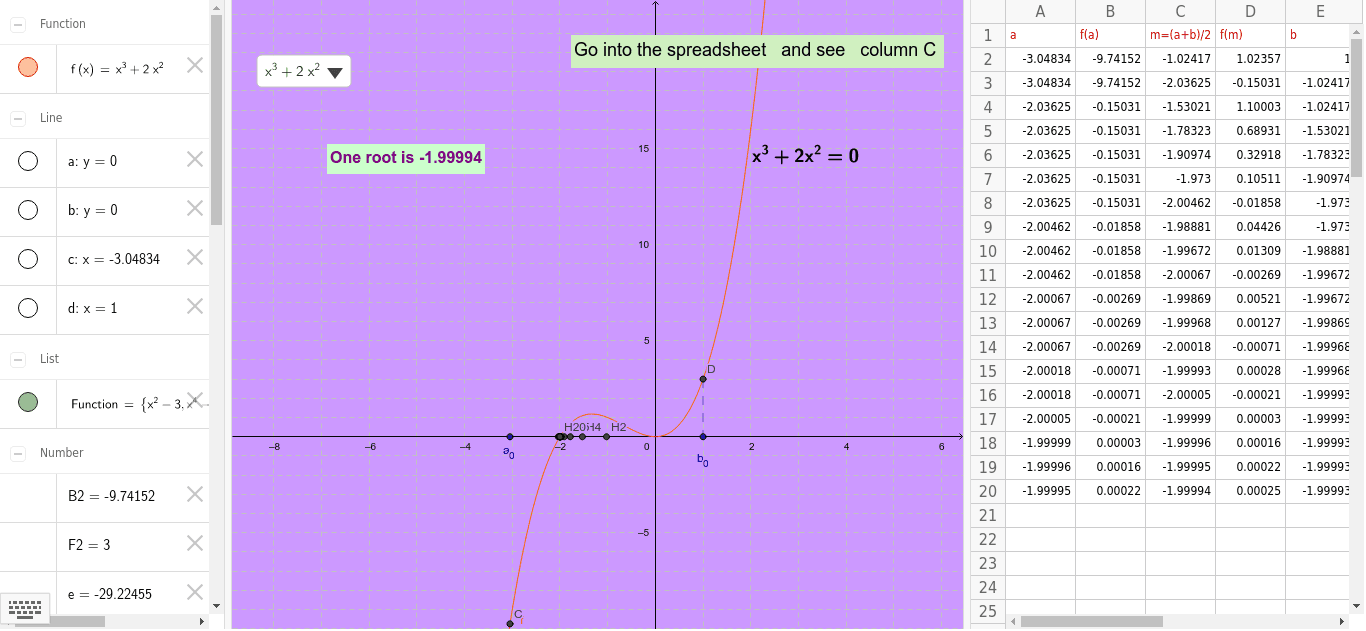
This example demonstrates the bisection method graphically to find a real root of a continuous function. Key math concepts include continuity, interval halving, and root determination. GeoGebra commands like Point, SelectedElement, If, Line, OrthogonalLine, Intersect, Segment, and Text are used to visualize intervals, midpoints, function graphs, and annotations. Suitable for high school mathematics education to understand the algorithmic and geometric principles of the bisection method.
GeoGebra Commands & Parameters
Point(xAxis) → APoint(xAxis) → BSelectedElement(Function) → fIf((B2 * D2) < 0, true, false) → G2If(G2, A2, C2) → A3If(G2, C2, E2) → E3If((B3 * D3) < 0, true, false) → G3If(G3, A3, C3) → A4If(G3, C3, E3) → E4If((B4 * D4) < 0, true, false) → G4If(G4, A4, C4) → A5If(G4, C4, E4) → E5If((B5 * D5) < 0, true, false) → G5If(G5, A5, C5) → A6If(G5, C5, E5) → E6If((B6 * D6) < 0, true, false) → G6If(G6, A6, C6) → A7If(G6, C6, E6) → E7If((B7 * D7) < 0, true, false) → G7If(G7, A7, C7) → A8If(G7, C7, E7) → E8If((B8 * D8) < 0, true, false) → G8If(G8, A8, C8) → A9If(G8, C8, E8) → E9If((B9 * D9) < 0, true, false) → G9If(G9, A9, C9) → A10If(G9, C9, E9) → E10If((B10 * D10) < 0, true, false) → G10If(G10, A10, C10) → A11If(G10, C10, E10) → E11If((B11 * D11) < 0, true, false) → G11If(G11, A11, C11) → A12If(G11, C11, E11) → E12If((B12 * D12) < 0, true, false) → G12If(G12, A12, C12) → A13If(G12, C12, E12) → E13If((B13 * D13) < 0, true, false) → G13If(G13, A13, C13) → A14If(G13, C13, E13) → E14If((B14 * D14) < 0, true, false) → G14If(G14, A14, C14) → A15If(G14, C14, E14) → E15If((B15 * D15) < 0, true, false) → G15If(G15, A15, C15) → A16If(G15, C15, E15) → E16If((B16 * D16) < 0, true, false) → G16If(G16, A16, C16) → A17If(G16, C16, E16) → E17If((B17 * D17) < 0, true, false) → G17If(G17, A17, C17) → A18If(G17, C17, E17) → E18If((B18 * D18) < 0, true, false) → G18If(G18, A18, C18) → A19If(G18, C18, E18) → E19If((B19 * D19) < 0, true, false) → G19If(G19, A19, C19) → A20If(G19, C19, E19) → E20If((B20 * D20) < 0, true, false) → G20Line(A, xAxis) → aLine(A, a) → bOrthogonalLine(A, b) → cOrthogonalLine(B, b) → dIntersect(f, c) → CIntersect(f, d) → DSegment(D, B) → gText(f) → text2If(e > 0, text4, text1) → text5
AI Drawing Prompt Reference
Draw a graph of the bisection method for finding real roots of a continuous function. Start by creating points A and B on the x-axis, then plot the function f. Use the sign of the function values at the midpoints to iteratively halve the interval and find the root approximation. Include midpoints, intervals, function graph, and annotations to illustrate the geometric principles of the bisection method.
The prompt above was compiled from the original drawing commands and is for reference only.