
Binomial Probability: Guessing on an 8-Question Multiple-Choice Test
Loading the math board and drawing, please wait…
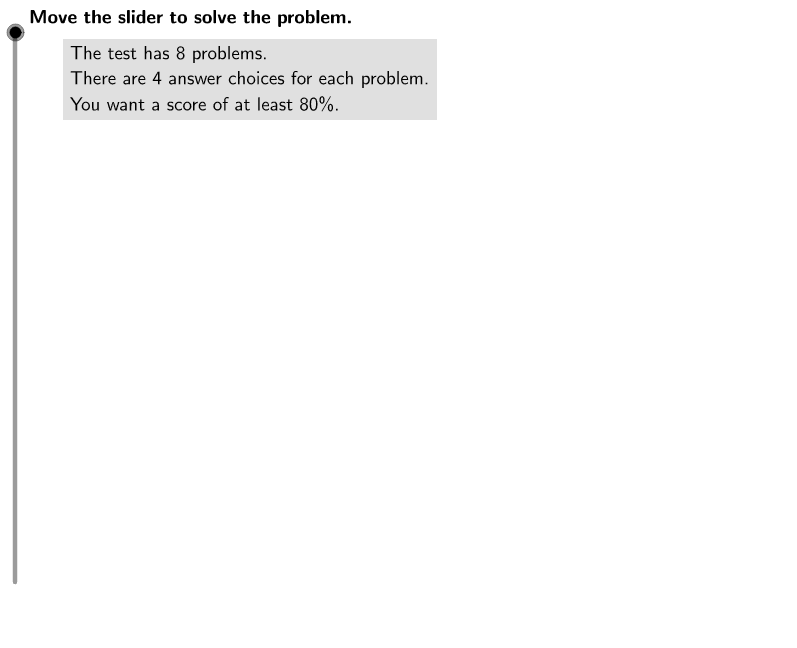
This GeoGebra example demonstrates how to compute probabilities for a binomial distribution in the context of randomly guessing answers on an 8-question multiple-choice test with 4 options each. It visualizes the probability of getting exactly k questions correct, cumulative probabilities, and the minimum number of correct answers needed to pass. Key mathematical concepts include binomial distribution, probability mass function, combinations, and expected value. The construction uses sliders (stepper, stepMax) to adjust parameters, a randomization button to simulate outcomes, and LaTeX/TableText commands to display probability tables and formulas. Objects such as questions, choices, success, failure, percent, weight, needed, ProbAll, ProbUsed, and ProbNeeded are used to calculate and present results dynamically. This resource is suitable for high school or introductory college statistics courses to illustrate real-world applications of binomial probability and random simulation.
GeoGebra Commands & Parameters
LaTeX(steps) → counterLaTeX("\text{Use the buttons below to return to the original problem or}\cr\text{randomly generate a similar practice problem.}") → RandomizationTextCorner(1) → ACorner(3) → BFirst(Xall, questions + 1) → XusedLast(Xused, questions - needed + 1) → XneededFirst(ProbAll, questions + 1) → ProbUsedLast(ProbUsed, questions - needed + 1) → ProbNeededFirst(ProbFormAll, questions + 1) → ProbFormUsedLaTeX("\text{Determine whether this is a binomial distribution.}") → text1LaTeX("\text{Make a probability distribution table.}") → text3TableText({Append[Text["X"], Xused], Append[Text["P(X) formula"], ProbFormUsed], Append[Text["P(X) value"], ProbUsed]}, "vc|_") → text5LaTeX((("\text{Determine the minimum number of problems needed to get " * percent) * "% on the test.}")) → text6TableText({Append[Text["X"], Xneeded], Append[Text["P(X) value"], ProbNeeded]}, "vc|_") → text10LaTeX("\text{Is this probability empirical or theoretical?}") → text14LaTeX("\text{This is a theoretical probability because it is not based on data or an experiment;}\cr\text{it is based purely on calculation.}") → text15LaTeX((((((("\text{If there are " * questions) * " problems on the test, then each problem is worth}\cr\textcolor{#000099}{\frac{100}{") * questions) * "}=") * weight) * "\%}\text{ on the test.}")) → text7LaTeX((("\text{Use the distribution table to calculate the probability of guessing " * listRight) * " answers}\cr\text{correctly. The relevant section is copied below for convenience.}")) → text9LaTeX("\text{Move the slider to solve the problem.}") → text0LaTeX((((((((("\textcolor{#000099}{P(\text{" * percent) * "% right by guessing among ") * choices) * " choices on ") * questions) * " problems}) \approx ") * Psafe) * "}")) → text12LaTeX((((((("\text{The test has " * questions) * " problems.}\cr\text{There are ") * choices) * " answer choices for each problem.}\cr\text{You want a score of at least ") * percent) * "%.}")) → ProblemLaTeX((((((((((("\text{This is a binomial distribution because your answer to each problem will be}\cr\text{either correct or incorrect. In this case, }\textcolor{#000099}{n}\text{ is }\textcolor{#000099}{" * questions) * "}\text{ (the number of problems) and }\cr\text{the probability }\textcolor{#000099}{p}\text{ of success (guessing the correct answer) is }\textcolor{#000099}{\frac{1}{") * choices) * "}}\text{ or }\textcolor{#000099}{") * success) * "}\text{.}\cr\text{Therefore, the probability of failure, }\textcolor{#000099}{1 – p}\text{, is }\textcolor{#000099}{1 – ") * success) * "}\text{ or }\textcolor{#000099}{") * failure) * "}.")) → text2LaTeX("\text{Recall that in a binomial experiment which consists of }\textcolor{#000099}{n}\text{ trials, the probability}\cr\text{that there will be }\textcolor{#000099}{r}\text{ successes is }\textcolor{#000099}{P(r) = {_n}C_r p^r (1 – p)^{n – r}}\text{, where }\textcolor{#000099}{p}\text{ is the probability}\cr\text{of success. Use this formula to find each probability.}") → text4LaTeX((((((((((((((("\text{If you want to score " * percent) * "%, then you need to get at least }\textcolor{#000099}{\frac{") * percent) * "}{") * weight) * "}}\text{ problems}\cr\text{right. Since each question is either entirely wrong or entirely right, fractional values}\cr\text{need to be rounded up. In this case, you need to get at least ") * needed) * " problems}\cr\text{right in order to get ") * percent) * "% on the test (") * needed) * " problems gives a score of ") * neededGives) * "%).}")) → text8LaTeX((((("\text{Add the probabilites for guessing " * listRight) * " answers correctly to get}\cr\text{the probability of scoring ") * percent) * "% on this test by random guessing.}")) → text11LaTeX((((((((("\text{The probability of getting a grade above " * percent) * "% on a test that has ") * choices) * " choices }\cr\text{for each of ") * questions) * " problems by guessing at every answer is about ") * PsafePercent) * "% (to two}\cr\text{decimal places).}")) → text13
AI Drawing Prompt Reference
Create an educational diagram illustrating binomial probability for guessing on an 8-question multiple-choice test with 4 options each. On the left, show a problem statement explaining that each question has 4 choices, with a success probability of 1/4. On the right, display a table listing the number of correct answers from 0 to 8, along with the probability formula and computed probability for each, highlighting the minimum number needed to pass and its probability. Below, include the binomial probability formula and a slider to adjust parameters, plus a button to randomly generate a new problem. The layout should be clear, with text explanations, a probability table, and formulas, demonstrating theoretical probability calculation.
The prompt above was compiled from the original drawing commands and is for reference only.