
Binomial Distribution with Normal Curve
Loading the math board and drawing, please wait…
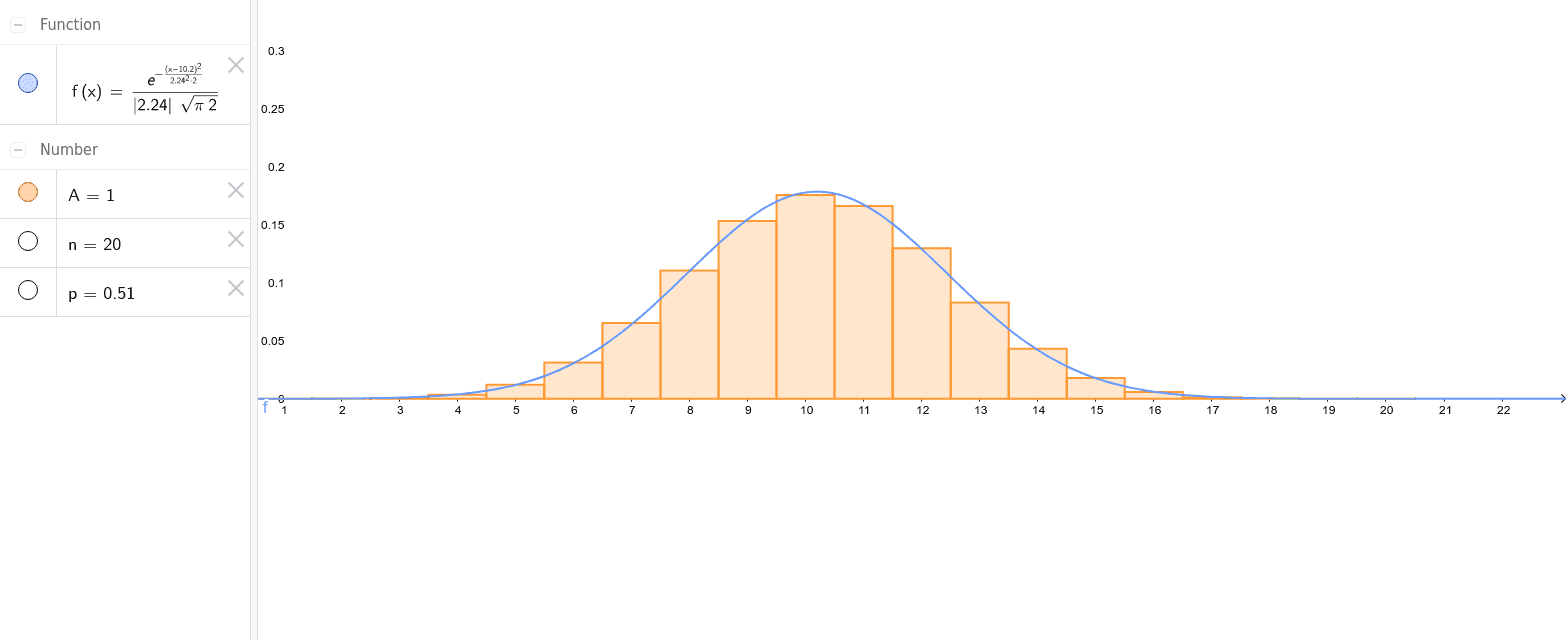
This example demonstrates the relationship between the Binomial Distribution B(n,p) and the Normal Curve. Key math concepts include Binomial Distribution, Normal Distribution, Statistics, Area Calculation, and Piecewise Functions. The construction uses GeoGebra commands BarChart for bar chart and Normal for the normal distribution curve, with sliders p and n to control parameters. Suitable for high school and above students to understand the approximation of binomial distribution by normal distribution under the law of large numbers.
GeoGebra Commands & Parameters
BarChart(-0.5, n + 0.5, Sequence[((Binomial[n, k] * p^(k)) * (1 - p)^(n - k)), k, 0, n]) → ANormal((n * p), sqrt(((n * p) * (1 - p))), x) → f
AI Drawing Prompt Reference
Draw a bar chart representing a binomial distribution with parameters n and p adjustable via sliders, and overlay a normal distribution curve with mean np and standard deviation sqrt(np(1-p)), to illustrate the approximation of the binomial distribution by the normal distribution as n increases.
The prompt above was compiled from the original drawing commands and is for reference only.