
Binomial Distribution Simulation
Loading the math board and drawing, please wait…
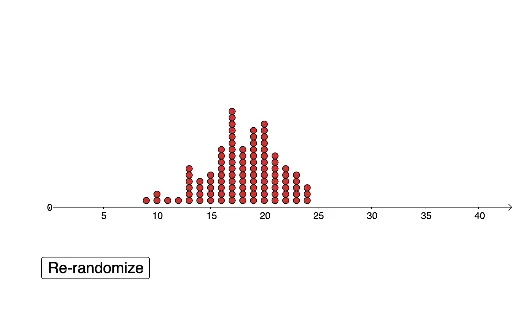
This example demonstrates the simulation of a Binomial Random Variable. It visually represents the properties of the Binomial Distribution, aiding learners in understanding probability distributions and statistical concepts. Key math concepts include Binomial Distribution, Probability Distributions, and Stochastic Processes. The construction utilizes GeoGebra commands like Sequence and DotPlot, along with objects such as text1, n, text2, p, text3, s, l1, button1, l3, l2, to achieve visualization and interactive parameter adjustment. Suitable for high school and above, for probability and statistics education and experimental demonstrations.
GeoGebra Commands & Parameters
Sequence(RandomBinomial[n, p], w, 1, s) → l1Sequence(RandomBinomial[n, p], w, 1, s) → l3DotPlot(l1, false, 0.2) → l2
AI Drawing Prompt Reference
Create a visualization for simulating a binomial random variable, showing a sequence representing the variable and a dot plot to visualize its distribution, with adjustable parameters n and p to observe distribution changes, aiming to demonstrate probability distributions and statistical concepts for educational purposes.
The prompt above was compiled from the original drawing commands and is for reference only.