
Binomial Distribution by ULeth
Loading the math board and drawing, please wait…
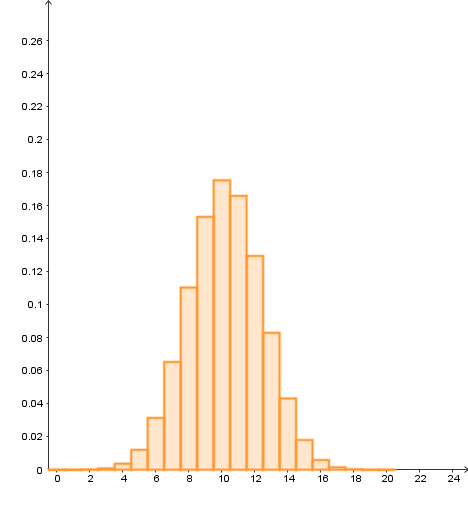
This example demonstrates the binomial distribution. It involves the core mathematical concept of binomial distribution in probability and statistics. Using the GeoGebra command BarChart, you can observe the effects of different parameters n and p on the binomial distribution. Suitable for high school mathematics education and learning probability statistics.
GeoGebra Commands & Parameters
BarChart(-0.5, n + 0.5, Sequence[((Binomial[n, k] * p^(k)) * (1 - p)^(n - k)), k, 0, n]) → A
AI Drawing Prompt Reference
Create a bar chart for a binomial distribution with n set to 10 and p set to 0.5. First, define the values of n and p, then use the BarChart command with k ranging from 0 to n, calculating the binomial probability for each k and plotting it as a bar chart.
The prompt above was compiled from the original drawing commands and is for reference only.