
Bifurcation Diagram Construction by Justin Dunmyre
Loading the math board and drawing, please wait…
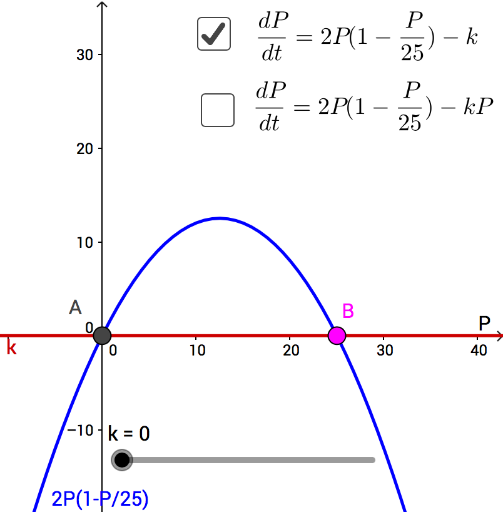
This example demonstrates how to construct a bifurcation diagram using GeoGebra, visually representing the dynamic behavior of a system as a parameter changes. Key math concepts include dynamical systems, parameter variation, limit behavior, and function iteration. Construction highlights from the summary involve commands like Intersect and Point, along with objects such as f, k, g, A, B, p1, p2, b1, b2, a, b, text1, text2, kmax, c, ymin, kmin. Suitable for high school students and math enthusiasts studying chaos theory and dynamical systems, or for calculus instruction.
GeoGebra Commands & Parameters
Intersect(f, g) → A, BPoint({k, p1}) → b1Point({k, p2}) → b2