
Basic Tools for Two-Variable Analysis
Loading the math board and drawing, please wait…
In collections
ggbchat #4 July 16 2014
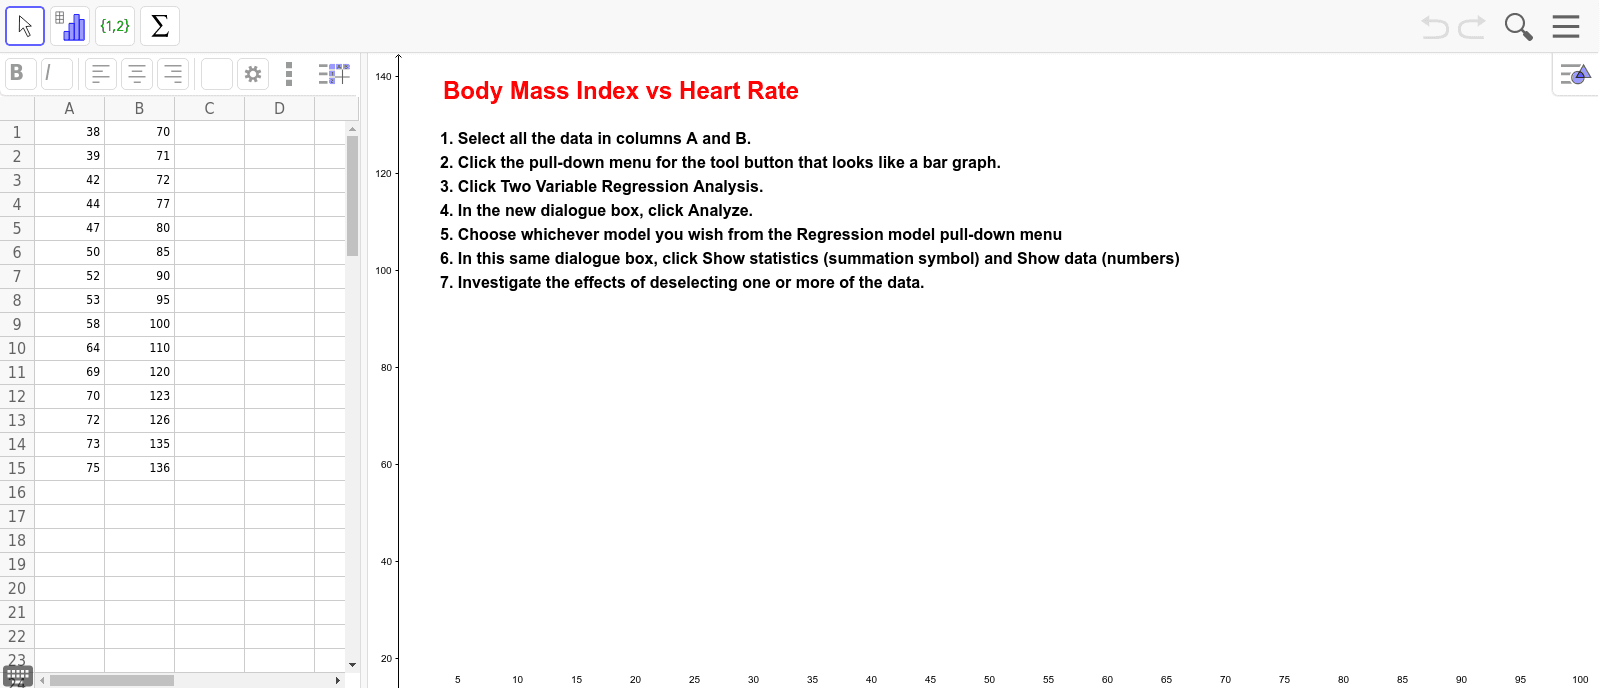
This example demonstrates the fundamental tools available for two-variable analysis. It involves core mathematical concepts such as statistics and coordinate geometry. The construction utilizes GeoGebra commands like BoxPlot and Text, along with objects A1-A15 and B1-B15. It is suitable for high school students and learners seeking to master basic data analysis techniques.
GeoGebra Commands & Parameters
BoxPlot(1, 0.3333333333333333, {70, 71, 72, 77, 80, 85, 90, 95, 100, 110, 120, 123, 126, 135, 136}, true) →BoxPlot(2, 0.3333333333333333, {38, 39, 42, 44, 47, 50, 52, 53, 58, 64, 69, 70, 72, 73, 75}, true) →Text(" B1:B15 ", (13.5, 1)) →Text(" A1:A15 ", (13.5, 2)) →
AI Drawing Prompt Reference
Draw two box plots, one using the dataset {70, 71, 72, 77, 80, 85, 90, 95, 100, 110, 120, 123, 126, 135, 136} and the other using {38, 39, 42, 44, 47, 50, 52, 53, 58, 64, 69, 70, 72, 73, 75}, positioned above and below each other in the coordinate system, with labels 'B1:B15' and 'A1:A15' on the right side respectively.
The prompt above was compiled from the original drawing commands and is for reference only.