
Basic Quadratic Function (II): Quick Exploration of Parameters a and c
Loading the math board and drawing, please wait…
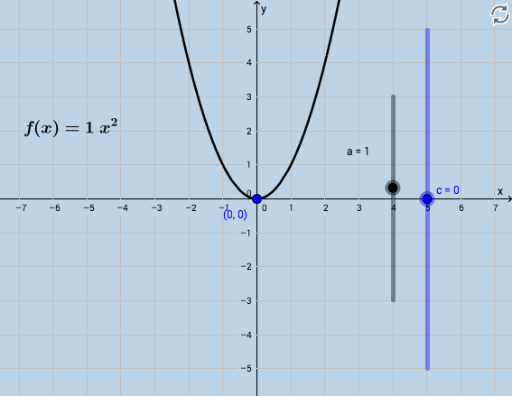
This GeoGebra example demonstrates how the graph of the quadratic function y = ax² + c changes as parameters a and c vary, focusing on the direction of opening, width, and vertical shift of the parabola. Core mathematical concepts include the standard form of a quadratic function, vertex coordinates, axis of symmetry, and the effects of parameters on the shape and position of the graph. Construction highlights: sliders control parameters a and c, the function object f plots the parabola, text objects text2 and text3 display current parameter values in real time, a button (button1) resets or toggles parameters, and point A marks the vertex. Suitable for middle school advanced students or high school learners to intuitively grasp quadratic graph transformations, and useful for classroom demonstrations or self-guided exploration.
GeoGebra Commands & Parameters
Numeric c(0)Numeric a(1)f(x) = (a * x^(2)) + c(0, c)
AI Drawing Prompt Reference
Draw a graph of a quadratic function in the form y = a*x^2 + c. Include two sliders to adjust the values of parameters a and c, with their current values displayed on screen. The parabola should change its opening direction, width, and vertical position as the parameters vary, with its vertex always on the y-axis at the point (0, c). Mark the vertex with a small point, and add a button to reset or toggle the parameters. The layout should be clean and suitable for exploring how the parameters affect the graph.
The prompt above was compiled from the original drawing commands and is for reference only.