
Bar Graphs and Pie Charts
Loading the math board and drawing, please wait…
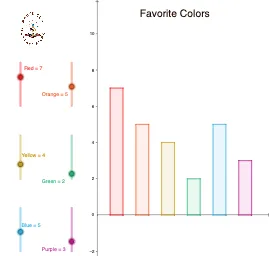
This example demonstrates how to create bar graphs and pie charts using GeoGebra. It involves core math concepts like data visualization, statistical charts, and probability & statistics. Key GeoGebra commands/objects used include Polygon, Segment, Rotate, Intersect, and CircleSector. Suitable for middle school and above students learning data statistics and chart drawing, or for teaching demonstrations.
GeoGebra Commands & Parameters
Polygon(A, C, D, B) → q1, a, c, d, bPolygon(E, G, H, F) → q2, e, g, h, fPolygon(I, K, L, J) → q3, i, k, l, jPolygon(M, O, P, N) → q4, m, o, p, nPolygon(Q, S, T, R) → q5, q, s, t, rPolygon(U, W, Z, V) → q6, u, w, z_1, vSegment((0, 0), (0, 1)) → f_1Rotate((0, 1), RAngle°, (0, 0)) → A_1Segment((0, 0), A_1) → g_1Intersect(f_1, g_1) → B_1Intersect(c_1, f_1, 1) → C_1Intersect(c_1, g_1, 1) → D_1CircleSector(B_1, C_1, D_1) → d_1Rotate(D_1, OAngle°, B_1) → E_1Segment(B_1, E_1) → h_1CircleSector(B_1, D_1, E_1) → e_1Rotate(E_1, YAngle°, B_1) → F_1CircleSector(B_1, E_1, F_1) → k_1Rotate(F_1, GAngle°, B_1) → G_1CircleSector(B_1, F_1, G_1) → p_1Rotate(G_1, BAngle°, B_1) → H_1CircleSector(B_1, G_1, H_1) → q_1CircleSector(B_1, H_1, C_1) → r_1