
Bar Graph vs Histogram
Loading the math board and drawing, please wait…
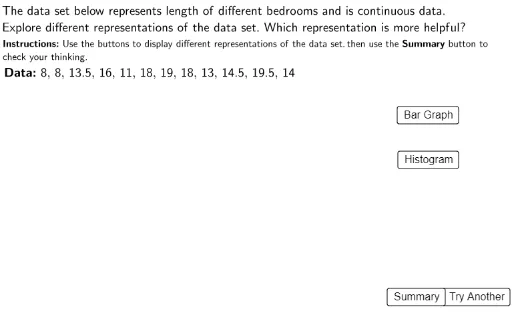
This example contrasts bar graphs and histograms to demonstrate different ways of representing data. Key mathematical concepts include frequency distribution, statistical measures (such as mode and median), and data visualization. GeoGebra commands like Element, Random, Sequence, and Frequency are used to construct the charts. Suitable for middle school and above students to learn data statistics and chart representation.
GeoGebra Commands & Parameters
Element({"continuous", "discrete", "discrete", "discrete", "continuous", "continous", "discrete"}, ImgNum) → datatypeTextRandom(1, 3) → ObjectRandom(LowestValue + 4, LowestValue + 5) → DiscreteHighestRandom(LowestValue + 10, LowestValue + 12) → ContHighestSequence(Random[LowestValue, DiscreteHighest], i, 1, 12) → DiscreteListFrequency(DiscreteList) → DiscreteFrequencySequence(((Random[LowestValue, ContHighest] * 10) + (Random[0, 1] * 5)) / 10, i, 1, 12) → ContListFrequency(ContList) → ContFrequencyIf(datatype ≟ 0, ContList, DiscreteList) → DataListIf(datatype ≟ 0, ContFrequency, DiscreteFrequency) → FreqListSort(Unique[DataList]) → UniqueListIf(datatype ≟ 0, ContHighest, DiscreteHighest) → HighestValueMax(FreqList) → MaxFreqMin(DataList) → LowMax(DataList) → HighIf(datatype ≟ 1, 0.7, 0.3) → BarWidthBarChart(UniqueList, FreqList, BarWidth) → BarGraphLaTeX("\textbf{Data\text{:}}\ 8,\,6.5,\,12,\,7.5,\,14,\,12,\,7.5,\,10.5,\,11,\,14.5,\,9,\,7") → Data1LaTeX("\textbf{Data\text{:}}\ 8,\,8,\,13.5,\,16,\,11,\,18,\,19,\,18,\,13,\,14.5,\,19.5,\,14") → Data2LaTeX("\textbf{Data\text{:}}\ 11,\,8.5,\,10.5,\,5.5,\,6.5,\,10,\,3.5,\,7.5,\,11,\,8,\,11,\,11.5") → Data3LaTeX("\textbf{Data\text{:}}\ 4,\,10.5,\,9,\,12,\,11.5,\,15.5,\,14,5,\,5.5,\,7,\,13.5,\,12") → Data5LaTeX("\textbf{Data\text{:}}\ 3,\,1.5,\,4,\,2.5,\,9,\,2.5,\,10,\,9.5,\,1,\,12,\,12,\,9") → Data4LaTeX("\textbf{Data\text{:}}\ 12,\, 14.5,\, 19.5,\, 10.5,\, 10.5,\, 16.5,\, 10.5,\, 17,\,11.5,\, 12.5,\, 19,\, 20") → Data6LaTeX("\textbf{Data\text{:}}\ 4,\, 4,\, 4,\, 1,\, 3,\, 3,\, 2,\, 4,\,2,\, 3,\, 3,\, 3") → Data7If(ImgNum ≟ 1, LaTeX[Data1], If[ImgNum ≟ 2, LaTeX[Data2], If[ImgNum ≟ 3, LaTeX[Data3], If[ImgNum ≟ 4, LaTeX[Data4], If[ImgNum ≟ 5, LaTeX[Data5], If[ImgNum ≟ 6, LaTeX[Data6], LaTeX[Data7]]]]]]) → DataListDisplaySort(ContList) → sortedContListLaTeX("Continuous\ data\ often\ consists\ of\ a\ wide\ variety\ of\ values.\, This\ results\ in\ many\ frequencies\\ of\ 1\ and\ means\ that\ the\ bar\ graph\ may\ not\ be\ as\ helpful\ as\ the\ histogram.") → SummarTextLaTeX("\textbf{Instructions\text{:}}\ Use\ the\ buttons\ to\ display\ different\ representations\ of\ the\ data\ set.\, then\ use\ the\ \textbf{Summary}\ button\ to\\ check\ your\ thinking.") → Instructions2LaTeX("weight\ of\ chairs\ at\ a\ restaurant") → Data1DescriptionLaTeX("length\ of\ different\ bedrooms") → Data2DescriptionLaTeX("length\ of\ triangle\ bases") → Data3DescriptionLaTeX("height\ of\ trees\ in\ the\ park") → Data5DescriptionLaTeX("volume\ of\ water\ held\ in\ containers") → Data4DescriptionLaTeX("weight\ of\ children") → Data6DescriptionElement({Data1Description, Data2Description, Data3Description, Data4Description, Data5Description, Data6Description}, ImgNum) → DataDescriptionLaTeX("The\ data\ set\ below\ represents\ " + DataDescription + "\ and\ is\ continuous\ data.\\ Explore\ different\ representations\ of\ the\ data\ set.\ Which\ representation\ is\ more\ helpful?") → Instructions