
Bar Chart vs Pie Chart Comparison
Loading the math board and drawing, please wait…
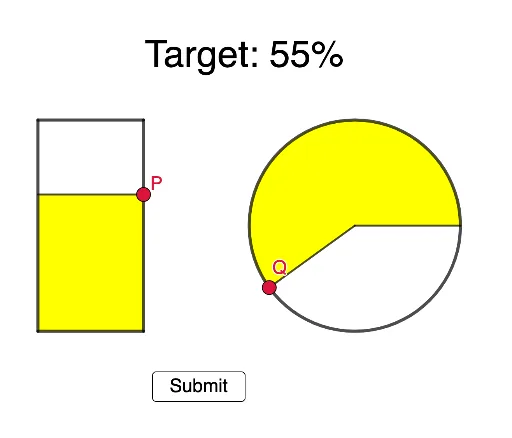
This example demonstrates how to compare the ease of filling a certain percentage in bar charts versus pie charts. It involves core math concepts like statistics, percentages, and geometric area/proportion. Constructed using GeoGebra commands like Point, Polygon, Circle, Segment, CircleSector, RandomElement. Suitable for middle school and above, helping students understand different data visualization methods and their applications.
GeoGebra Commands & Parameters
Point(xAxis) → APoint(xAxis) → BPolygon(A, B, C, D) → q1, a, b, c, dCircle(E, 4) → ePoint(d) → PPoint(e) → GPoint(e) → QPolygon(B, A, P, P + B - A) → q2, b_1, a_1, f, gSegment(P, P + B - A) → hCircleSector(E, G, Q) → kSegment(E, G) → iSegment(E, Q) → jRandomElement(l1) → l