
Axis Independence Demonstration
Loading the math board and drawing, please wait…
In collections
Complex Math
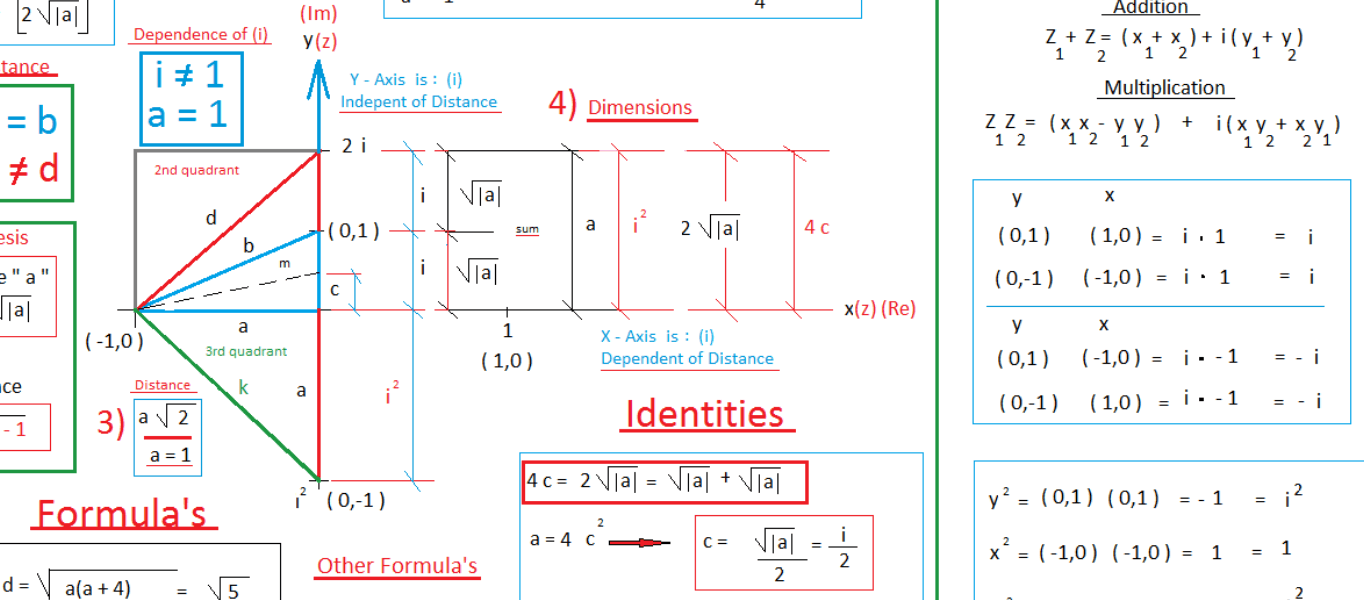
This example demonstrates the independence of coordinate axes through a graphical representation, challenging traditional algebraic and geometric perceptions. Core mathematical concepts include coordinate geometry and function graphing. Construction highlights the use of GeoGebra commands/objects A, B, and pic1. Suitable for high school and above students to understand the fundamental principles of coordinate geometry.
GeoGebra Commands & Parameters
Point A(-3.52, -12.6)Point B(33.78, -12.6)
AI Drawing Prompt Reference
Draw a Cartesian coordinate system, then mark points A and B on the x-axis at coordinates (-3.52, 0) and (33.78, 0) respectively, and connect them with a line. Next, choose any point on the y-axis and draw a vertical line segment to represent the y-axis. Finally, draw a line passing through points A and B, and label these key points and lines on the graph.
The prompt above was compiled from the original drawing commands and is for reference only.