
Averages - Interactive Practice
Loading the math board and drawing, please wait…
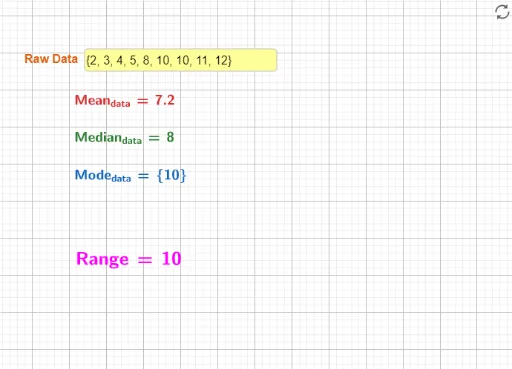
This example uses interactive practice to help students understand the concepts of mean, median, and mode. Using GeoGebra commands like mean, Median, and Mode, students can visually see how changes in data affect these statistics. Suitable for students in middle school and above for introductory statistics learning.
GeoGebra Commands & Parameters
mean(a) → Mean_{data}Median(a) → Median_{data}Mode(a) → Mode_{data}LaTeX(Mean_{data}, true, true) → text1LaTeX(Median_{data}, true, true) → text2LaTeX(Mode_{data}, true, true) → text3Textfield(a) → InputBox1LaTeX(Range, true, true) → text5
AI Drawing Prompt Reference
Draw a chart with a set of data points and calculate and display the mean, median, and mode. Observe how these statistics change as you adjust the positions of the data points. Below the chart, show the values of these statistics and provide an input box for entering new data points.
The prompt above was compiled from the original drawing commands and is for reference only.