
Average Value of a Function
Loading the math board and drawing, please wait…
In collections
AP Calculus AB Applet Collection
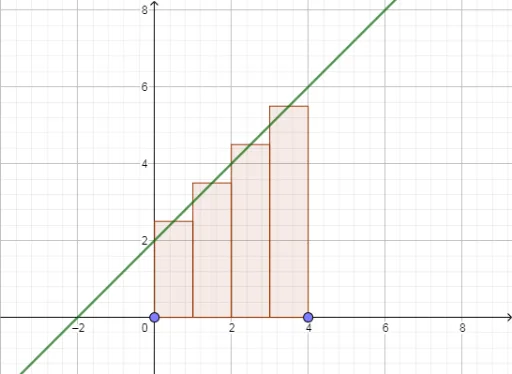
This example demonstrates how to calculate the average value of a function over a given interval. Key mathematical concepts include the definition of function integration and average value. Through constructing rectangles and integrals, the process of calculating the average value is visually understood. GeoGebra commands used include TextField, Point, RectangleSum, Integral, and Polygon. Suitable for high school mathematics education and learning.
GeoGebra Commands & Parameters
Textfield(f) → InputBox1Point(xAxis) → APoint(xAxis) → BRectangleSum(f, x(A), x(B), n, 0.5) → rsumIntegral(f, x(A), x(B)) → ExAreaPolygon((x(A), 0), (x(B), 0), (x(B), ExArea / (x(B) - x(A))), (x(A), ExArea / (x(B) - x(A)))) → Avg, h, i, j, k
AI Drawing Prompt Reference
Draw the average value graph of function f over the interval [A, B]. First, input the function f, then create the interval [A, B], calculate the integral ExArea of the function over the interval, construct a rectangle area rsum, and finally build a trapezoid Avg with height ExArea/(B-A) to represent the average value of function f over the interval [A, B].
The prompt above was compiled from the original drawing commands and is for reference only.