
Average Value Animation
Loading the math board and drawing, please wait…
In collections
Average Value
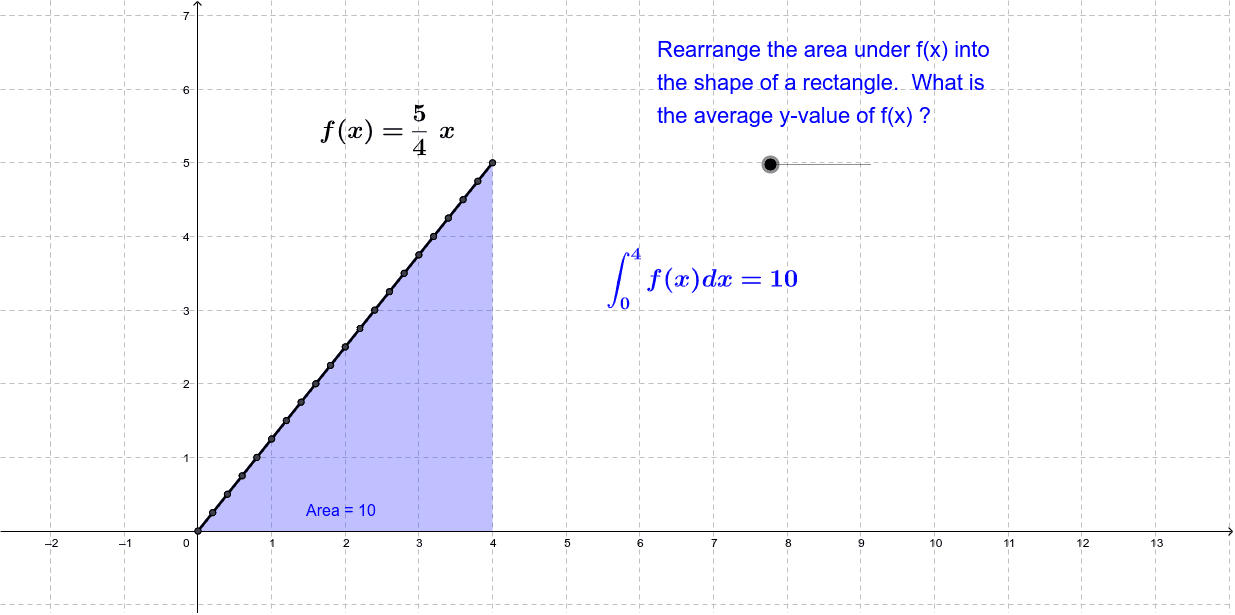
This example graphically animates the average y-value of a function. Key mathematical concepts include integration and average value. It uses GeoGebra commands such as Function, Integral, and Segment. Suitable for high school mathematics, particularly calculus and function graphing.
GeoGebra Commands & Parameters
Function((5 / 4 * x), 0, 4) → fIntegral(f, 0, 4) → bFunction(b / 4, 0, 4) → gFunction((a * g(x)) + ((1 - a) * f(x)), 0, 4) → hIntegral(h, 0, 4) → AreaSegment(V, A) → cSegment(W, B) → dSegment(Z, C) → eSegment(A_1, D) → iSegment(B_1, E) → jSegment(C_1, F) → kSegment(G, D_1) → lSegment(H, E_1) → mSegment(I, F_1) → nSegment(J, G_1) → pSegment(K, H_1) → qSegment(L, I_1) → rSegment(M, J_1) → sSegment(N, K_1) → tSegment(O, L_1) → a_1Segment(P, M_1) → b_1Segment(Q, N_1) → c_1Segment(R, O_1) → d_1Segment(S, P_1) → e_1Segment(Q_1, T) → f_1Segment(R_1, U) → g_1