
Automated Tractor Mowing Trial: Linear Functions & Scatter Plot Demo
Loading the math board and drawing, please wait…
In collections
CCGPS CA Unit 4 Lesson 2
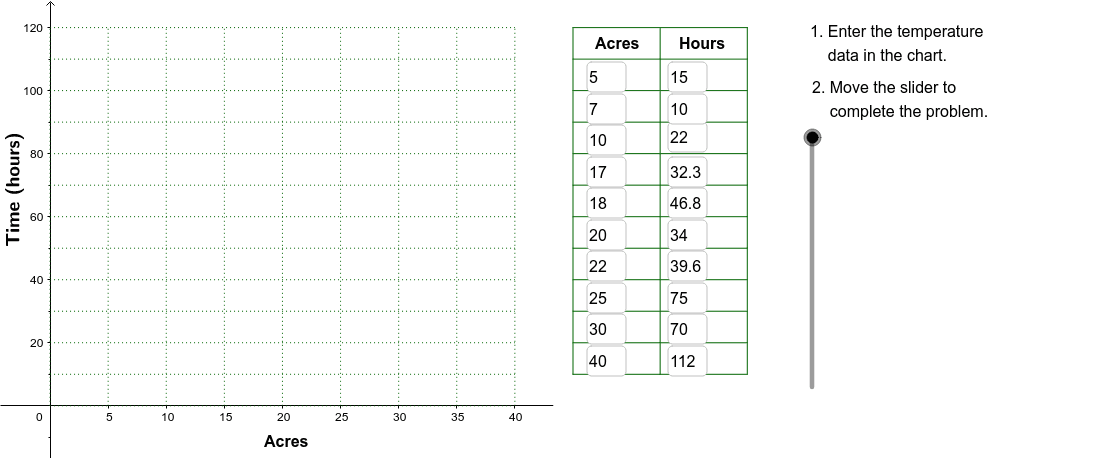
① This example demonstrates the trial data of automated tractors mowing fields of various sizes, plotting a scatter plot and fitting a linear function model. ② Core mathematical concepts include linear functions, linear equations, scatter plots, similarity transformations, and area calculation of rectangular fields. ③ Construction highlights: Corner and Polygon create rectangular fields; Sequence generates multiple trial points; Line draws the fitted line; Slider animates parameter changes; Textfield and VerticalText label coordinates and values. ④ Suitable for high‑school algebra and statistics courses, and as a college‑prep demonstration of linear regression and geometric modeling.
GeoGebra Commands & Parameters
Corner(2) → Corn2Corner(3) → Corn3Polygon(Corn1, Corn2, Corn3, Corn4) → poly1, corn1, corn2, corn3, corn4Textfield(A2) → InA2Textfield(A3) → InA3Textfield(A4) → InA4Textfield(A5) → InA5Textfield(A6) → InA6Textfield(A7) → InA7Textfield(A8) → InA8Textfield(A9) → InA9Textfield(B9) → InB9Textfield(B8) → InB8Textfield(B7) → InB7Textfield(B6) → InB6Textfield(B5) → InB5Textfield(B4) → InB4Textfield(B3) → InB3Textfield(B2) → InB2Line(Pt1, Pt2) → FitLineSequence(Segment[(45, 10 + (10 * j)), (60, 10 + (10 * j))], j, 0, 11) → LnListSequence(Segment[(45 + (7.5 * j), 10), (45 + (7.5 * j), 120)], j, 0, 2) → LnList2Textfield(A10) → InA10Textfield(A11) → InA11Textfield(B10) → InB10Textfield(B11) → InB11VerticalText("\text{Time (hours)}") → DownLegendSequence(Segment[((5 * i), 0), ((5 * i), 120)], i, 0, 8) → GridxSequence(Segment[(0, (10 * i)), (40, (10 * i))], i, 0, 12) → Gridy