
Area under a curve as a limit
Loading the math board and drawing, please wait…
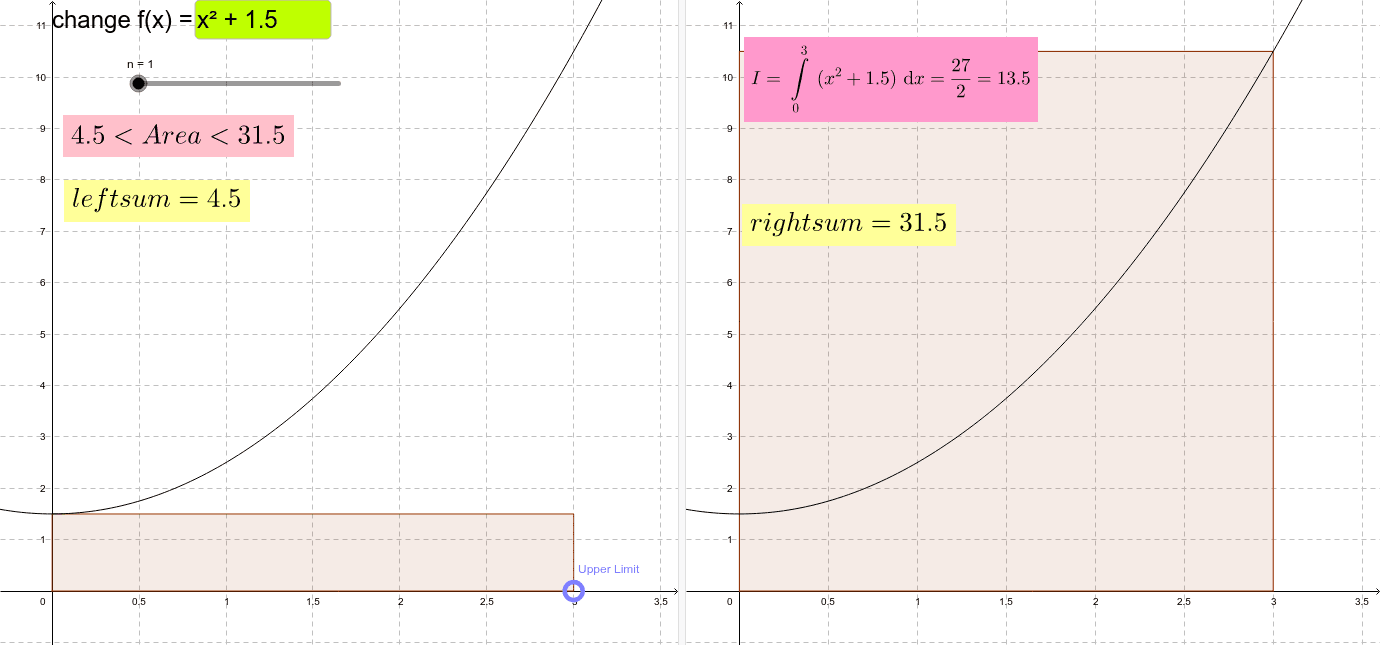
This example explores the concept of area under a curve as a limit by dynamically adjusting the function, number of rectangles, and right-hand limit. It involves mathematical concepts such as limits, integration, and geometric area calculation. Construction uses GeoGebra commands like RectangleSum, Integral, Min, Max, etc. Suitable for high school students or early university students to understand calculus fundamentals and geometric intuition.
GeoGebra Commands & Parameters
Point(xAxis) → ATextfield(f) → inputBox1RectangleSum(f, 0, e, n, 0) → aRectangleSum(f, 0, e, n, 1) → bIntegral(f, 0, x(A)) → dMin(a, b) → lowerMax(a, b) → upperFractionText(d) → text2Min(((-yhigh)) / 10, (1.1 * y(Min[f, 0, e]))) → ylow
AI Drawing Prompt Reference
Draw the process of approximating the area under a curve by adjusting the function expression, number of rectangles, and right-hand limit. Start by plotting a point on the x-axis, then input the function expression, use the rectangle sum method to calculate the approximate area, compare the areas of two different divisions, and finally compute and display the integral value.
The prompt above was compiled from the original drawing commands and is for reference only.