
Area of Fence Example 1: Surface Area over a Astroid Path
Loading the math board and drawing, please wait…
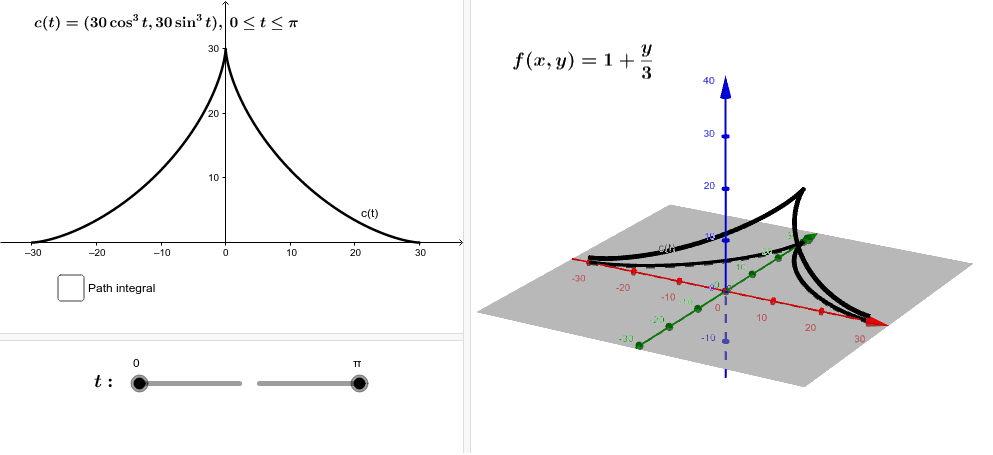
This example demonstrates how to compute the area of a fence (a surface) whose base is a parametric curve and whose height varies along the path. Specifically, the base path is the astroid c(t)=(30cos³t, 30sin³t) for t from 0 to π, and the height of the fence is given by a function, leading to a definite integral for the total area. Core mathematical concepts include parametric equations, line integrals, definite integrals, and simplification of trigonometric powers. Construction highlights: using GeoGebra commands such as Derivative and Simplify to handle derivatives and expressions, CurveCartesian to plot the parametric curve, Sequence to generate sample points, Integral to compute the area, and lists/points for visualization. This example is suitable for advanced high school or university calculus courses when teaching the geometric meaning of curve integrals and area calculations, as well as for math lab sessions demonstrating practical applications of parametric curves and integration.
GeoGebra Commands & Parameters
Derivative((30 * sin(x)^(3))) → hDerivative((30 * cos(x)^(3))) → gSimplify(p) → sCurveCartesian((30 * cos(t)^(3)), (30 * sin(t)^(3)), t, a, b) → CurveSequence(Curve(a + (k * (b - a) / n)), k, 0, n, 1) → pointsSequence(Curve(a + (k * (b - a) / n)) + (0, 0, 0), k, 0, n, 1) → ptsSequence((x(Element[pts, k]), y(Element[pts, k]), f(x(Element[pts, k]), y(Element[pts, k]))), k, 1, n + 1, 1) → list1Sequence(Segment[Element[pts, k], Element[list1, k]], k, 1, n + 1) → list2CurveCartesian((30 * cos(t)^(3)), (30 * sin(t)^(3)), 1 + ((30 * sin(t)^(3))) / 3, t, a, b) → cIntegral(r, a, b) → d
AI Drawing Prompt Reference
Draw an astroid path in the xy-plane, defined by parametric equations with cosine and sine cubed terms, for parameter values from 0 to π. Along this path, place a sequence of equally spaced sample points. From each point, extend a vertical line segment upward to a height determined by a given function of x and y, forming a fence-like surface. Connect the base points to their corresponding top points with line segments to show the fence's structure. Also draw a space curve representing the top edge of the fence, whose height varies along the path. Finally, shade the area of the fence with a semi-transparent surface or fill, and indicate the computed area value from the definite integral. Present the scene in a 3D perspective to emphasize the relationship between the curve integral and the area.
The prompt above was compiled from the original drawing commands and is for reference only.