
Area Model of Multiplication: Place-Value Decomposition and Rectangular Areas
Loading the math board and drawing, please wait…
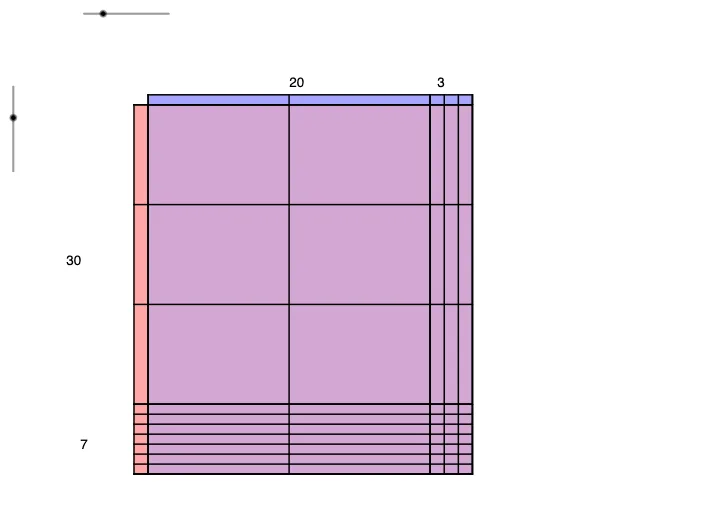
This GeoGebra example demonstrates the area model of multiplication, visually representing multi-digit multiplication by decomposing factors into tens and ones and computing partial products as rectangular areas. Core mathematical concepts include the distributive property of multiplication, place-value decomposition, rectangular area formulas, and the geometric correspondence between partial products and the total product. The construction employs GeoGebra commands such as Polygon to draw rectangles and polygons, Text and TableText for labels and data tables, Mod and Div for place-value splitting, and Join and Zip for generating point sets and line segments. Objects including topPoints, sidePoints, vertLines, horLines, placeValueLines, and mover support grid lines, place-value dividers, and slider-driven animation. Suitable for upper elementary and middle school mathematics instruction, classroom demonstrations, and student exploration of the geometric meaning of multiplication.
GeoGebra Commands & Parameters
Mod(f1, 10) → f1OnesDiv(f1, 10) → f1TensDiv(abs(f2), 10) → f2TensMod(abs(f2), 10) → f2OnesJoin({Sequence[Point[{(i * 10), 0}], i, 0, f1Tens], Sequence[Point[{(10 * f1Tens) + i, 0}], i, 0, f1Ones]}) → topPointsJoin({Sequence[Point[{0, ((-i) * 10)}], i, 0, f2Tens], Sequence[Point[{0, (-10 * f2Tens) - i}], i, 0, f2Ones]}) → sidePointsZip(Segment[AAA + (0, 1), AAA + (0, (f2 * mover))], AAA, topPoints) → vertLinesZip(Segment[AAA + (-1, 0), AAA + ((f1 * mover), 0)], AAA, sidePoints) → horLinesPolygon((0, 0), (0, f2), A, B, C, (f1, 0)) → poly1, f, g, a, b, c, hPolygon((0, 0), (f1, 0), (f1, 1), (0, 1)) → f1poly, i, j, k, lPolygon((0, 0), (0, f2), (-1, f2), (-1, 0)) → f2poly, n, p, q, rText((f1Tens * 10), ((f1Tens * 5), 1 + m / 50)) → text1Text(f1Ones, ((f1Tens * 10) + f1Ones / 2 - 1, 1 + m / 50)) → text2Text(f1, (f1 / 2 - 1, 1 + m / 50)) → text3Polygon((0, 0), (f1, 0), (f1, f2), (0, f2)) → rectangle, s, t, f_1, g_1Text(abs(f2), (-1 - d - m / 10, f2 / 2 - 1)) → text4Text((f2Tens * 10), (-1 - d - m / 10, ((-f2Tens) * 5) - 1)) → text5Text(f2Ones, ((-d) - m / 10, ((-f2Tens) * 10) - f2Ones / 2 - 1)) → text6TableText({((f1Tens * f2Tens) * 100), ((f1Ones * f2Tens) * 10)}, {((f1Tens * f2Ones) * 10), (f1Ones * f2Ones)}, "|_|") → text8TableText({((f1Tens * f2Tens) * 100), ((f1Ones * f2Tens) * 10)}, "|_|") → text9TableText({((f1Tens * f2Tens) * 100)}, {((f1Tens * f2Ones) * 10)}, "|_|") → text10TableText({((f1Tens * f2Ones) * 10), (f1Ones * f2Ones)}, "|_|") → text11
AI Drawing Prompt Reference
Draw a multiplication area model that shows how two numbers are decomposed into tens and ones, and partial products are represented as rectangular areas. Include grid lines, place-value dividers, and a slider for animation. Draw rectangles and polygons to represent the areas, and add text labels and data tables to explain the relationships between partial products. The construction order should be: first decompose the factors, then draw grid lines and dividers, next draw rectangles and polygons, and finally add labels and tables to illustrate the geometric meaning of multiplication.
The prompt above was compiled from the original drawing commands and is for reference only.