
Partial Products Multiplication Facts Demo
Loading the math board and drawing, please wait…
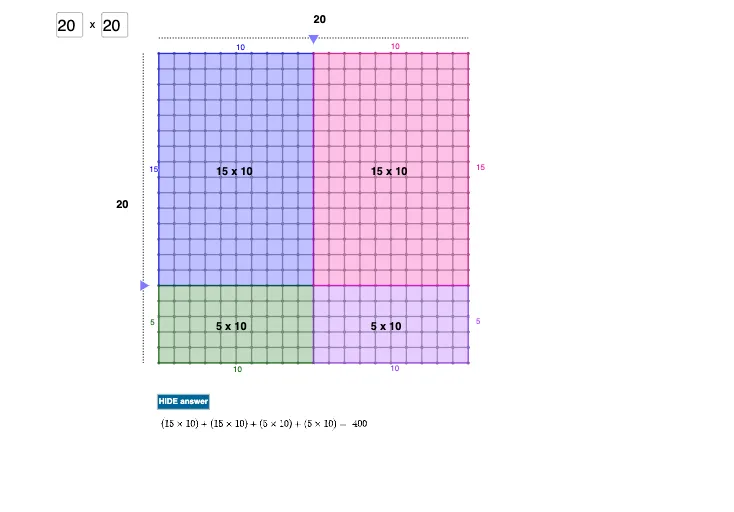
This GeoGebra example demonstrates multiplication facts using the partial‑products (area) model. It visualizes how a two‑digit multiplication can be broken into smaller rectangular areas representing each partial product. Core mathematical concepts include multiplication, partial products, area models, place‑value decomposition, and integer arithmetic. The construction employs Textfield for user input, Segment, Point, and Polygon to build the grid and rectangles, Sequence to generate grid lines, Flatten to manage arrays, and Line, Centroid, Midpoint for positioning and labeling. The material is suitable for upper elementary to lower secondary mathematics instruction and serves as an introductory example for mathematical modeling and visual programming.
GeoGebra Commands & Parameters
Textfield(factor1number) → Factor1Textfield(factor2number) → Factor2Segment((x(A) - a, y(A)), (x(A) - a, y(A) - factor1number)) → fSegment((x(A), y(A) + a), (x(A) + factor2number, y(A) + a)) → gPoint(f) → BPoint(g) → CFlatten(Sequence[Sequence[(x(A) + j, y(A) - i), j, 0, factor2number], i, 0, factor1number]) → DotsArraySequence(Segment[Element[DotsArray, i], Element[DotsArray, ((factor2number + 1) * factor1number) + i]], i, 0, factor2number + 1, 1) → GridVerticalSequence(Segment[Element[DotsArray, ((factor2number + 1) * i) + 1], Element[DotsArray, ((factor2number + 1) * i) + factor2number + 1]], i, 0, factor1number, 1) → GridHorizontalPolygon(A, D, F, E) → q1, a_1, d, f_1, eLine(E, F) → hLine(D, F) → iPolygon(D, G, H, F) → q2, d_1, g_1, h_1, f_2Polygon(F, H, I, K) → q3, f_3, h_2, i_1, kPolygon(E, F, K, J) → q4, e_1, f_4, k_1, jCentroid(q1) → MCentroid(q4) → NCentroid(q2) → OCentroid(q3) → PMidpoint(g) → QMidpoint(f) → R
AI Drawing Prompt Reference
Draw a diagram illustrating multiplication facts using the partial-products (area) model. The diagram should include a grid formed by horizontal and vertical line segments, with numbers labeled on the grid. There should be a rectangular area representing the product of two factors, aligned with the grid. The rectangle should be labeled with the product value. The diagram should clearly show how two-digit multiplication is decomposed into smaller rectangular areas. Ensure the layout is clear and easy to understand the multiplication concept.
The prompt above was compiled from the original drawing commands and is for reference only.