
Area Between Functions by cconrad
Loading the math board and drawing, please wait…
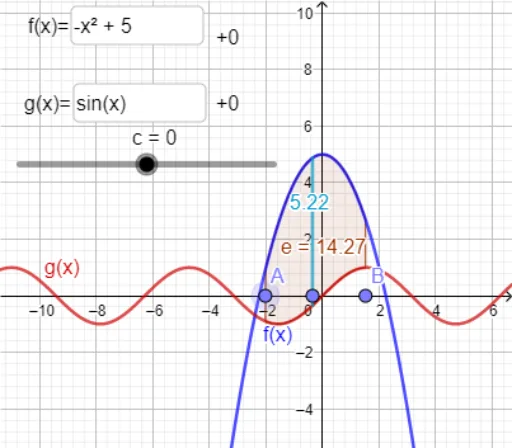
This example demonstrates how to calculate the area between two function graphs. It involves core math concepts like integration, function graphs, logarithmic functions, curve sketching, means, and secant lines. Constructed using GeoGebra commands/objects such as Point, Integral, IntegralBetween, Textfield, Segment, and Slider. Suitable for high school and above students learning area calculation in calculus.
GeoGebra Commands & Parameters
Point(xAxis) → APoint(xAxis) → BIntegral(abs(h(x)), x(A), x(B)) → dIntegralBetween(f, g, x(A), x(B)) → eTextfield(a) → InputBox1Textfield(b) → InputBox2Integral(h, x(A), x(B)) → jPoint(xAxis) → CSegment(D, E) → lSegment(G, F) → m
AI Drawing Prompt Reference
Draw two function graphs and calculate the area between them. Mark two points on the x-axis, use them as the limits of integration, and compute the integrals of an absolute value function and a custom function. Show the results of both integrals. Mark another point on the x-axis, connect the two points to form a line segment. Add text boxes for inputting function parameters and display the integral results and function graphs.
The prompt above was compiled from the original drawing commands and is for reference only.