
Are Hearing Aids Dangerous?
Loading the math board and drawing, please wait…
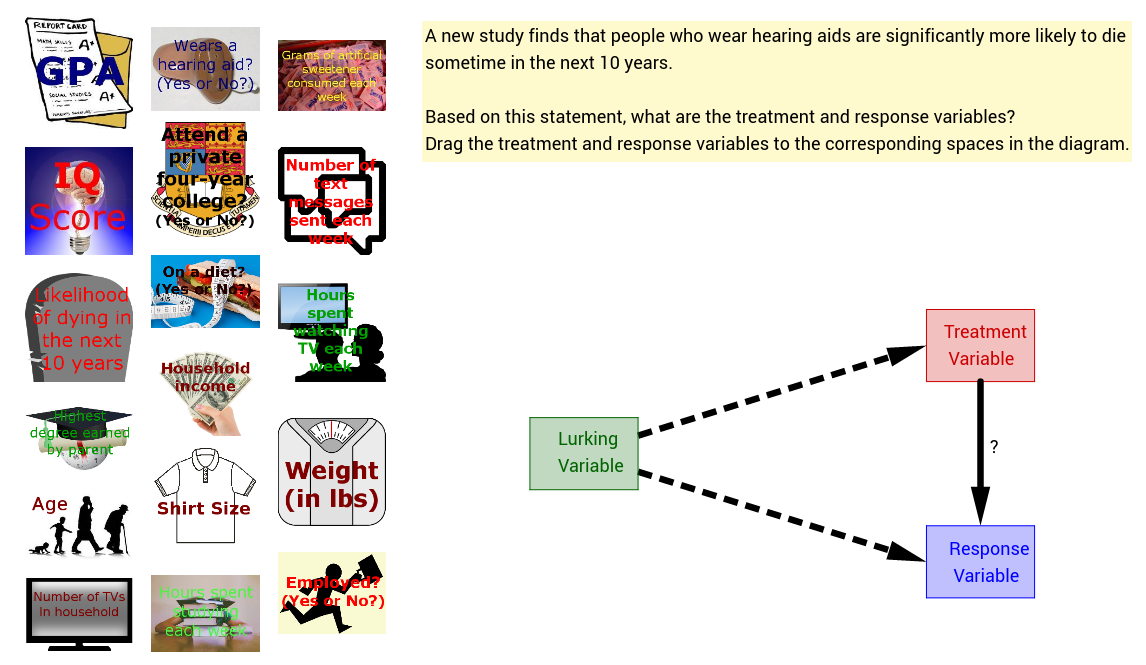
This example uses function graphs and inequalities to explore the safety of hearing aids. It demonstrates the frequency range of hearing aids and potential risks. Key mathematical concepts include function graphs, inequalities, and parametric equations. Using GeoGebra commands such as Polygon, Vector, and Function, users can dynamically adjust the frequency response of hearing aids. Suitable for high school students and teachers.
GeoGebra Commands & Parameters
Polygon(F, treatment, H, I) → treatmentPoly, f, g, h, iPolygon(J, response, L, M) → responsePoly, j, k, l, mPoint(g) → NPoint(m) → OVector(N, O) → uVector((0, 7), B) → vVector((0, 5), C) → wPolygon(A, P, lurking, R) → poly1, a, p, q, rSegment(hearingAid, treatment) → treatmentSegSegment(death, response) → responseSegSegment(age, lurking) → lurkingSegLength(lurkingSeg) → lurkingLenLength(treatmentSeg) → treatmentLenLength(responseSeg) → responseLen
AI Drawing Prompt Reference
Draw a safety analysis diagram for hearing aids. Start by drawing the frequency response area and then the potential risk area. Mark a point N on the frequency response curve and a point O on the potential risk curve, and connect them with vector u. Next, draw line segments treatmentSeg and responseSeg between the hearing aid and the potential risk, and measure their lengths. Finally, draw a line segment lurkingSeg between the hidden factor and the potential risk, and measure its length.
The prompt above was compiled from the original drawing commands and is for reference only.