
Analyzing Exponential Function Graphs and Properties
Loading the math board and drawing, please wait…
In collections
CCGPS AA Unit 4 Lesson 1
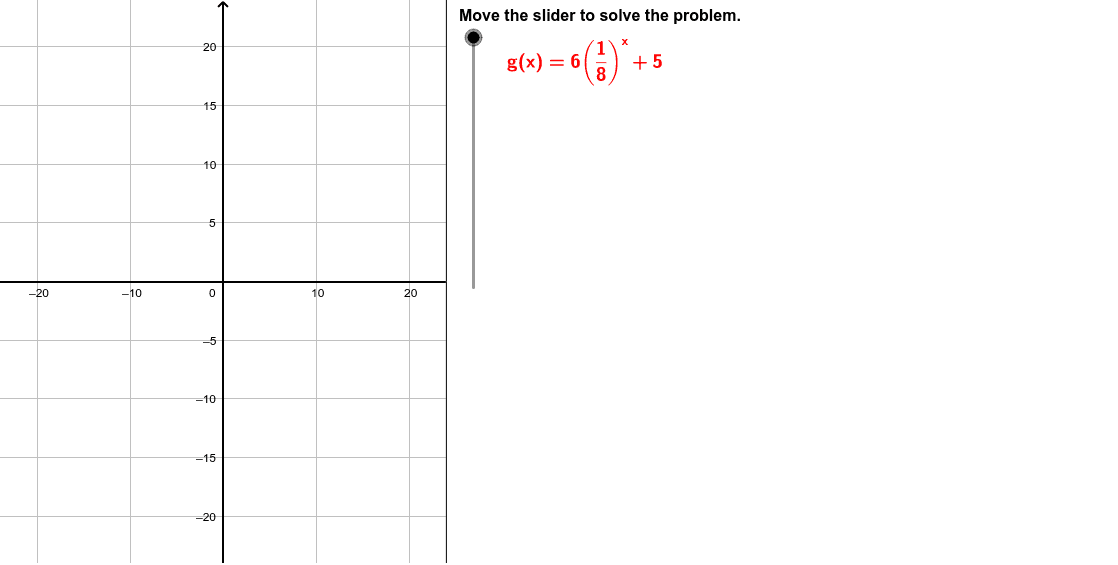
This example demonstrates how to analyze the graph characteristics of an exponential function, including domain, range, y-intercept, asymptote, and end behavior. The core math concepts involved are properties of exponential functions and graph analysis. GeoGebra commands and objects like Corner, Polygon, Segment, and Intersect are used to construct and analyze the function graph. Suitable for high school mathematics teaching to understand the basic properties of exponential functions.
GeoGebra Commands & Parameters
Corner(3) → C3Corner(2) → C2Polygon(C2, C3, (MaskEdge, y(C3)), (MaskEdge, y(C2))) → Mask, c2, c3, d, eSegment((MaskEdge, y(C2)), (MaskEdge, y(C3))) → BorderIntersect(xAxis, yAxis) → Origin
AI Drawing Prompt Reference
Draw the graph of an exponential function, labeling its domain, range, y-intercept, and asymptote, while analyzing its end behavior. Start by plotting a coordinate system with x and y axes. Then, draw a polygon in the first quadrant starting from the origin, representing the function's growth trend in the positive x-direction. Mark the y-intercept on the x-axis and draw a vertical asymptote. Finally, use a dashed line to indicate the function's asymptotic behavior and label key points.
The prompt above was compiled from the original drawing commands and is for reference only.