
Analyzing a Dataset of Daily Walking Distances
Loading the math board and drawing, please wait…
In collections
CCSS Support Algebra I Unit 3
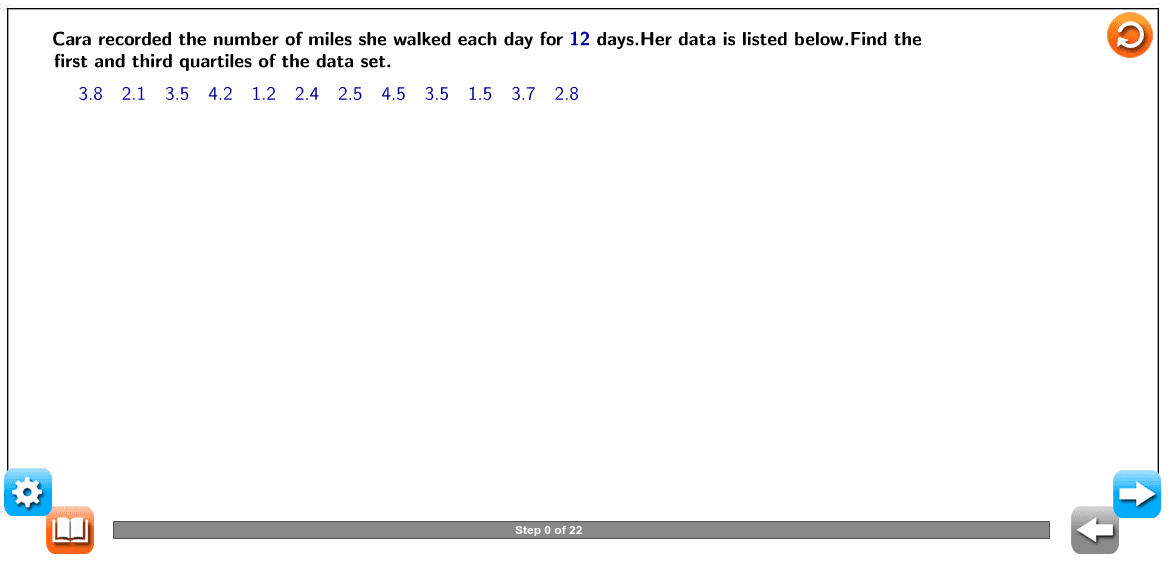
This example demonstrates how to analyze a dataset of recorded daily walking distances using GeoGebra. Key math concepts include data sorting, quartile calculation, and statistical graphing. The construction leverages commands like Sort, Element, LaTeX, roundFix, TableText, and objects such as Equaliser series for data organization and visualization. It is suitable for high school mathematics courses focusing on statistics and data analysis, serving as a teaching demonstration or student exercise.
GeoGebra Commands & Parameters
Sort(list2) → AsortElement(Asort, 4) → Asort4Element(Asort, 3) → Asort3LaTeX("\text{first and third quartiles of the data set.}") → text1roundFix(val1, 1) → R1roundFix(val2, 1) → R2roundFix(val3, 1) → R3roundFix(val4, 1) → R4roundFix(val5, 1) → R5roundFix(val6, 1) → R6roundFix(val7, 1) → R7roundFix(val8, 1) → R8roundFix(val9, 1) → R9roundFix(val10, 1) → R10roundFix(val11, 1) → R11roundFix(val12, 1) → R12LaTeX((("\text{" * R10) * "}")) → Equaliservalue10LaTeX((("\text{" * R11) * "}")) → Equaliservalue11LaTeX((("\text{" * R12) * "}")) → Equaliservalue12LaTeX((("\text{" * R2) * "}")) → Equaliservalue2LaTeX((("\text{" * R3) * "}")) → Equaliservalue3LaTeX((("\text{" * R4) * "}")) → Equaliservalue4LaTeX((("\text{" * R5) * "}")) → Equaliservalue5LaTeX((("\text{" * R6) * "}")) → Equaliservalue6LaTeX((("\text{" * R7) * "}")) → Equaliservalue7LaTeX((("\text{" * R8) * "}")) → Equaliservalue8LaTeX((("\text{" * R9) * "}")) → Equaliservalue9TableText({{LaTeX[(("\text{\textcolor{#000099}{" * R1) * "}}")], LaTeX[(("\text{\textcolor{#000099}{" * R2) * "}}")], LaTeX[(("\text{\textcolor{#000099}{" * R3) * "}}")], LaTeX[(("\text{\textcolor{#000099}{" * R4) * "}}")], LaTeX[(("\text{\textcolor{#000099}{" * R5) * "}}")], LaTeX[(("\text{\textcolor{#000099}{" * R6) * "}}")], LaTeX[(("\text{\textcolor{#000099}{" * R7) * "}}")], LaTeX[(("\text{\textcolor{#000099}{" * R8) * "}}")], LaTeX[(("\text{\textcolor{#000099}{" * R9) * "}}")], LaTeX[(("\text{\textcolor{#000099}{" * R10) * "}}")], LaTeX[(("\text{\textcolor{#000099}{" * R11) * "}}")], LaTeX[(("\text{\textcolor{#000099}{" * R12) * "}}")]}}) → QuestionText1LaTeX("\text{Order the data values from least to greatest. }") → text2LaTeX("\text{Find the smallest number of the remaining numbers in the original set and use it as the second number in the ordered list.}") → text5LaTeX("\text{Continue this process until all the numbers in the original list are crossed out.}") → text7Sort(list1) → sortElement(sort, 1) → sort1Element(sort, 2) → sort2Element(sort, 3) → sort3Element(sort, 4) → sort4Element(sort, 5) → sort5Element(sort, 6) → sort6Element(sort, 7) → sort7Element(sort, 8) → sort8Element(sort, 9) → sort9Element(sort, 10) → sort10Element(sort, 11) → sort11Element(sort, 12) → sort12TableText({{LaTeX[(("\text{\textcolor{#000099}{" * sort1) * "}}")], LaTeX[(("\text{\textcolor{#000099}{" * sort2) * "}}")], LaTeX[(("\text{\textcolor{#000099}{" * sort3) * "}}")], LaTeX[(("\text{\textcolor{#000099}{" * sort4) * "}}")], LaTeX[(("\text{\textcolor{#000099}{" * sort5) * "}}")], LaTeX[(("\text{\textcolor{#000099}{" * sort6) * "}}")], LaTeX[(("\text{\textcolor{#000099}{" * sort7) * "}}")], LaTeX[(("\text{\textcolor{#000099}{" * sort8) * "}}")], LaTeX[(("\text{\textcolor{#000099}{" * sort9) * "}}")], LaTeX[(("\text{\textcolor{#000099}{" * sort10) * "}}")], LaTeX[(("\text{\textcolor{#000099}{" * sort11) * "}}")], LaTeX[(("\text{\textcolor{#000099}{" * sort12) * "}}")]}}) → text9TableText({{LaTeX[(("\text{\textcolor{#000099}{" * sort1) * "}}")], LaTeX[(("\text{\textcolor{#000099}{" * sort2) * "}}")], LaTeX[(("\text{\textcolor{#000099}{" * sort3) * "}}")], LaTeX[(("\text{\textcolor{#000099}{" * sort4) * "}}")], LaTeX[(("\text{\textcolor{#000099}{" * sort5) * "}}")], LaTeX[(("\text{\textcolor{#000099}{" * sort6) * "}}")], LaTeX[(("\text{\textcolor{#000099}{" * sort7) * "}}")], LaTeX[(("\text{\textcolor{#000099}{" * sort8) * "}}")], LaTeX[(("\text{\textcolor{#000099}{" * sort9) * "}}")], LaTeX[(("\text{\textcolor{#000099}{" * sort10) * "}}")], LaTeX[(("\text{\textcolor{#000099}{" * sort11) * "}}")], LaTeX[(("\text{\textcolor{#000099}{" * sort12) * "}}")]}}) → text13LaTeX("\text{Find the mean of the middle two numbers.}") → text14LaTeX((("\text{" * R1) * "}")) → Equaliservalue1Element(Asort, 1) → Asort1Element(Asort, 2) → Asort2Element(Asort, 5) → Asort5Element(Asort, 6) → Asort6Element(Asort, 7) → Asort7Element(Asort, 8) → Asort8Element(Asort, 9) → Asort9Element(Asort, 10) → Asort10Element(Asort, 11) → Asort11Element(Asort, 12) → Asort12LaTeX("\text{The third quartile is the mean or average of the middle two numbers in the upper half.}") → text22TableText({{LaTeX[(("\text{\textcolor{#000099}{" * sort1) * "}}")], LaTeX[(("\text{\textcolor{#000099}{" * sort2) * "}}")], LaTeX[(("\text{\textcolor{#000099}{" * sort3) * "}}")], LaTeX[(("\text{\textcolor{#000099}{" * sort4) * "}}")], LaTeX[(("\text{\textcolor{#000099}{" * sort5) * "}}")], LaTeX[(("\text{\textcolor{#000099}{" * sort6) * "}}")], LaTeX[(("\text{\textcolor{#000099}{" * sort7) * "}}")], LaTeX[(("\text{\textcolor{#000099}{" * sort8) * "}}")], LaTeX[(("\text{\textcolor{#000099}{" * sort9) * "}}")], LaTeX[(("\text{\textcolor{#000099}{" * sort10) * "}}")], LaTeX[(("\text{\textcolor{#000099}{" * sort11) * "}}")], LaTeX[(("\text{\textcolor{#000099}{" * sort12) * "}}")]}}) → text23LaTeX((((("\text{\textcolor{#000099}{Q₃=\frac{" * Asort9) * "+") * Asort10) * "}{2}}}")) → text16LaTeX((("\text{\textcolor{#000099}{Q₃=\frac{" * UAdd) * "}{2}}}")) → text17LaTeX((("\text{\textcolor{#000099}{Q₃=" * UDiv) * "}}")) → text24LaTeX((((("\text{\textcolor{#000099}{Q₁= \frac{" * Asort3) * "+") * Asort4) * "}{2}}}")) → text15LaTeX((("\text{\textcolor{#000099}{Q₁=\frac{" * LAdd) * "}{2}}}")) → text20LaTeX((("\text{\textcolor{#000099}{Q₁=" * LDiv) * "}}")) → text18LaTeX("\text{Lower half}") → text26LaTeX("\text{Lower half}") → text27LaTeX("\text{Upper half}") → text29LaTeX("\text{Upper half}") → text28LaTeX((("\text{The smallest number is \textcolor{#000099}{" * sort1) * "}.}")) → text4LaTeX("\text{The ordered list of numbers is as follows:}") → text8LaTeX((("\text{Cara recorded the number of miles she walked each day for \textcolor{#000099}{" * total) * "} days.Her data is listed below.Find the}")) → QuestionTextLaTeX("\text{Find the smallest number and use it as the first number in a new,ordered list.Cross it out in the original list. }") → text3LaTeX((("\text{Cross it out in the original list.The next number is \textcolor{#000099}{" * sort2) * "}.}")) → text6LaTeX("\text{Find \textcolor{#000099}{Q₁},the first quartile.}") → text11LaTeX("\text{The first quartile is the mean,or average,of the middle two numbers in the lower half.}") → text12LaTeX((("\text{\textcolor{#000099}{Q₁},the first quartile,is \textcolor{#000099}{" * LDiv) * "}}.")) → text19LaTeX((("\text{\textcolor{#000099}{Q₃},the third quartile,is \textcolor{#000099}{" * UDiv) * "}}.")) → text25LaTeX("\text{Find \textcolor{#000099}{Q₃},the third quartile.}") → text21LaTeX("\text{\mathbf{First\;quartile} the value that identifies the lower \textcolor{#000099}{25%} of the data;the median of the }") → text31LaTeX("\text{\mathbf{Third\; quartile} value that identifies the upper \textcolor{#000099}{25%} of the data;the median of the}") → text33LaTeX("\text{upper half of the data set;\textcolor{#000099}{75%} of all data is less than this value;written as \textcolor{#000099}{Q₃}.}") → text34LaTeX("\text{lower half of the data set;written as \textcolor{#000099}{Q₁}.}") → text32LaTeX("\text{values.The first six numbers are in the lower half and the last six numbers are in the upper half.}") → text10LaTeX("\text{Cara recorded the number of miles she walked for \textcolor{#000099}{12} days;therefore,the data set has an even number of }") → text30
AI Drawing Prompt Reference
Create a statistical graph for a dataset of daily walking distances by first sorting the data in ascending order. Identify and label the first, second, third, and fourth quartiles. Calculate and display the median and mean of the data. Finally, clearly show all data points and statistical values on a coordinate plane to analyze the distribution and trends of the data.
The prompt above was compiled from the original drawing commands and is for reference only.