
Amplitude of a Sine Graph
Loading the math board and drawing, please wait…
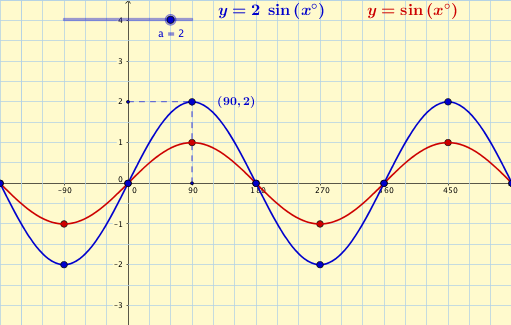
This GeoGebra example dynamically visualizes the amplitude of a sine function, demonstrating how the vertical stretch of the curve relates to the half-distance between its maximum and minimum values. The core mathematical concept is the amplitude parameter in trigonometric functions, which controls the height of the oscillation. The construction uses the Corner command to retrieve the drawing area boundaries (xmin, xmax, ymin, ymax), Sequence and Segment commands to build horizontal reference lines and vertical guides, and points A and B (or sliders) to adjust the amplitude interactively. Dynamic text objects (text1, text2, text3) display the current amplitude value. This resource is ideal for high school trigonometry lessons or introductory college mathematics, helping learners grasp how amplitude affects the sine graph's shape and compare it with frequency and phase shifts.
GeoGebra Commands & Parameters
Corner(5) → BSequence(((90 * n), f((90 * n))), n, floor(xmin / 90), ceil(xmax / 90)) → list1Sequence(((90 * n), g((90 * n))), n, floor(xmin / 90), ceil(xmax / 90)) → list2Segment((90, 0), C) → hSegment(E, C) → i