
Amplitude and Midline for a Sine-Type Function Graph
Loading the math board and drawing, please wait…
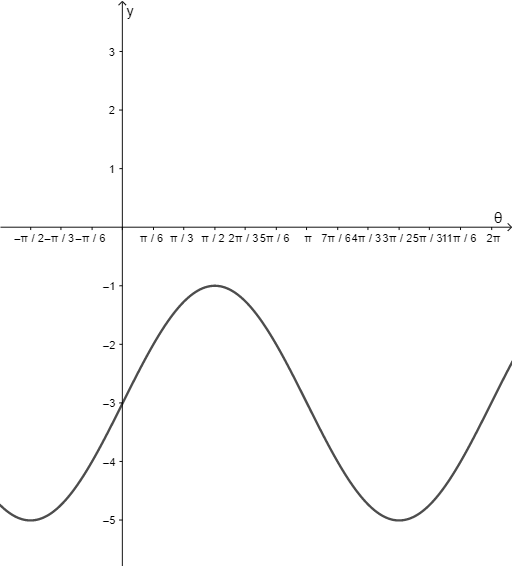
This example demonstrates how amplitude and midline determine the shape and vertical placement of a sine-type (periodic) function graph. It focuses on the key ideas of amplitude (the distance from the midline to a peak or trough) and the midline (the horizontal line around which the graph oscillates), along with practical graph features such as vertical stretching/compression and shifting. In GeoGebra, the construction is centered on the function object f: by parameterizing the function and updating its parameters, the graph dynamically reflects changes in amplitude and vertical offset (midline), letting learners visually track how the wave’s height and baseline move. Suitable for late secondary school through early college, especially for lessons on transformations of functions and reading periodic graphs.
GeoGebra Commands & Parameters
f: y = (2 * sin(x)) - 3
AI Drawing Prompt Reference
Draw a sine wave graph to demonstrate the effects of amplitude and vertical offset. Key objects include the sine curve, amplitude value, and vertical offset line. The relationship is that amplitude determines the wave's height, and vertical offset determines the midline position. The construction order is to first draw the basic sine curve, then adjust amplitude and vertical offset to dynamically change the graph, showing these features.
The prompt above was compiled from the original drawing commands and is for reference only.