
Alpha, Beta, and Power in Hypothesis Testing
Loading the math board and drawing, please wait…
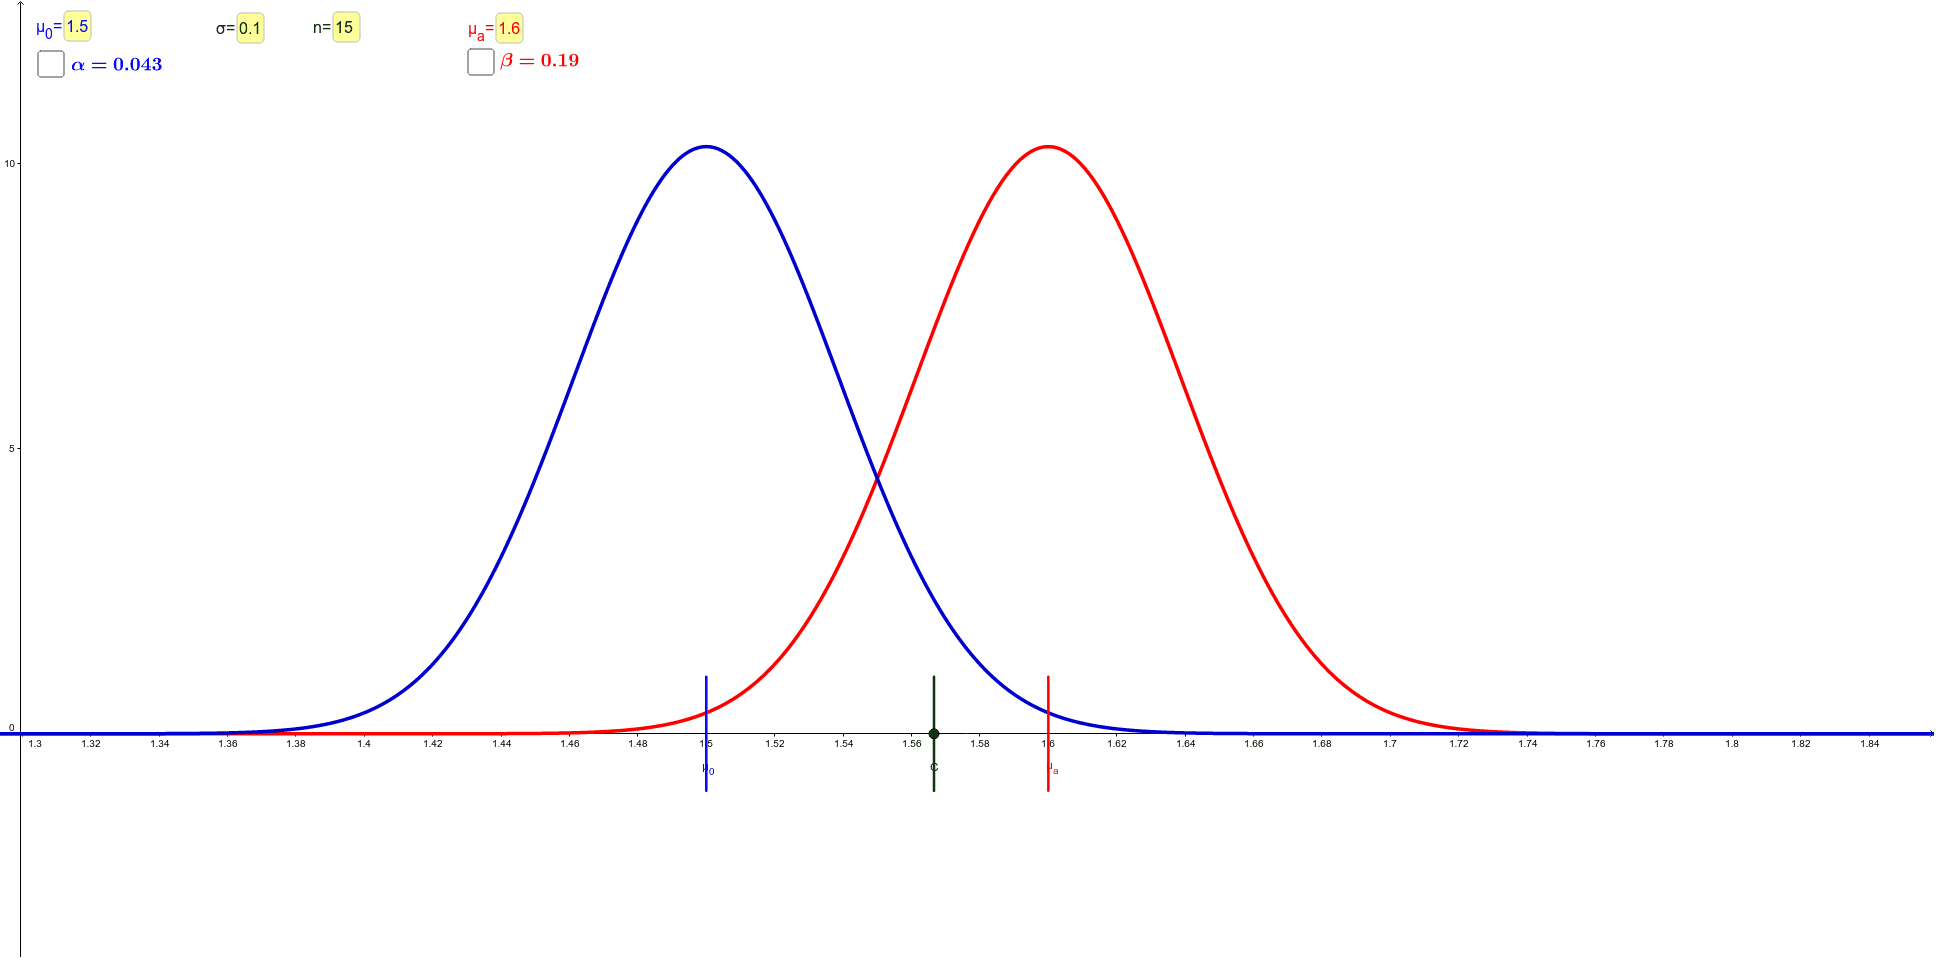
This GeoGebra example dynamically visualizes the relationship between Type I error (α), Type II error (β), and statistical power (1-β) in hypothesis testing. It uses normal distribution curves, critical regions, and sampling distributions to show how these error probabilities change with sample size, significance level, and effect size when the null and alternative means differ. Core mathematical concepts include hypothesis testing, normal distribution, significance level, power function, and the trade-off between Type I and Type II errors. Construction highlights: Point defines means, Normal generates distribution curves, OrthogonalLine creates perpendicular guides, Integral computes shaded areas representing α and β, Textfield and inputBox allow interactive parameter adjustment, and Segment connects key points. Suitable for high school or university statistics courses, this tool helps students understand decision rules and power analysis, and serves as an interactive classroom demonstration or self-study resource.
GeoGebra Commands & Parameters
Point(xAxis) → CNormal(μ_1, σ / n^(0.5), x, true) → IN_0Normal(μ_2, σ / n^(0.5), x, true) → IN_aNormal(μ_2, σ / n^(0.5), x) → N_aNormal(μ_1, σ / n^(0.5), x) → N_0OrthogonalLine(C, xAxis) → aIntegral(N_0, x(C), x(C) + (3 * σ / n^(0.5))) → I_0Textfield(n) → inputBox1Textfield(σ) → inputBox2Textfield(μ_0) → inputBox3Textfield(μ_a) → inputBox4OrthogonalLine(A, xAxis) → cOrthogonalLine(B, xAxis) → dIntegral(N_a, x(C) - (3 * σ / n^(0.5)), x(C)) → I_aSegment(FA, EA) → gSegment(FB, EB) → iPoint(i) → ESegment(EC, FC) → f
AI Drawing Prompt Reference
Create a statistical graph for hypothesis testing showing the relationship between Type I error (α), Type II error (β), and power. Place two points on the horizontal axis representing the null and alternative means. Draw two normal distribution curves centered at these means with equal standard deviations. Add a vertical line as the critical value, and shade the right tail of the null distribution and the left tail of the alternative distribution to represent α and β respectively. Include four input boxes to adjust sample size, standard deviation, and the two means. Connect key points on the curves with line segments for visual reference. The graph should clearly illustrate the overlap between the two distributions and how error probabilities change.
The prompt above was compiled from the original drawing commands and is for reference only.